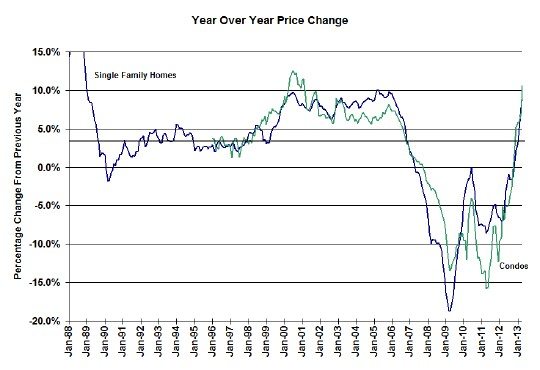
Today’s release of the Case Shiller home price index for April confirms what we’ve all been feeling about home prices in Chicago: they are on a tear. On a year over year basis single family home prices rose at the fastest rate in 8 years. For condominiums it was the fastest rate in 12 years. The entire country is in firmly positive territory and Chicago is no longer at the lower end of the spectrum, though we have a long way to go to catch up to first place San Francisco, which rose 23.9% over last year!
I actually had to rescale my year over year home price change graph for Chicago below in order to capture how dramatically prices have reversed course and to put it in historical perspective. Single family home prices were up 9.4% over last year while condominium prices were up a whopping 10.6%. And April marks the 6th month in a row of price increases on a year over year basis.
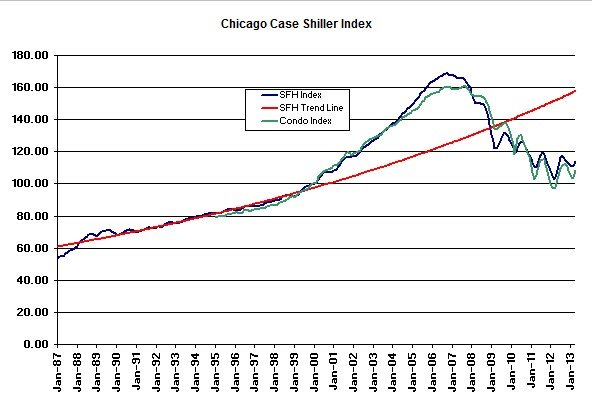
Compared to March single family home prices were up 2.7% and condominium prices were up 4.2% as we pull out of the normal seasonal slump in home prices. That puts single family home prices back to June 2001 levels and condos back to August 2000 levels, so Chicago homeowners still have a long way to go to catch up. But looking at the graph below you would think that catching up would be inevitable, given that we are still 27.9% below the long term trend line.
Single family home prices have still lost 32.6% of their peak value while condos have lost 32.7% of their peak value. So for people who bought at the peak they have a long way to go. But people who bought single family homes at the bottom (I think we can safely talk about a bottom now) are now up 10.6% and condo buyers who bought at the bottom are up 11.4%.
Sounding a decidedly optimistic note on the national housing picture, David M. Blitzer, Chairman of the Index Committee at S&P Dow Jones Indices, said:
The 10- and 20-City Composites posted their highest monthly gains in the history of S&P/Case-Shiller Home Price Indices…The recovery is definitely broad based. The two Composites showed the largest year-over-year gains in seven years…Recent economic data on home sales and inventories confirm the housing recovery’s strength.
Last week’s comments from the Fed and the resulting sharp increase in Treasury yields sparked fears that rising mortgage rates will damage the housing rebound. Home buyers have survived rising mortgage rates in the past, often by shifting from fixed rate to adjustable rate loans. In the housing boom, bust and recovery, banks’ credit quality standards were more important than the level of mortgage rates. The most recent Fed Senior Loan Officer Opinion Survey shows that some banks are easing credit restrictions. Given this, the recovery should continue.
Chicago Home Price Changes By Zip Code
Since real estate is all about location everyone is wondering how their own neighborhood is faring with these price increases. This data is normally hard to come by because Case Shiller doesn’t make the more granular data available to the general public. However, you are in luck because just last week Crain’s published a cool little heat map that shows the Case Shiller home price changes for most Chicago zip codes through the end of last year. You can click on a zip code for more detail but beware of one little nuance: Chicago zip codes do not exactly correspond to the specific community areas listed in the popup. For instance, although 60614 has a lot of overlap with Lincoln Park it is not exactly the same thing.
BTW, my zip code of 60622 was up 8.1%. Yeah, me!
If you want to keep up to date on the Chicago real estate market, get an insider’s view of the seamy underbelly of the real estate industry, or you just think I’m the next Kurt Vonnegut you can Subscribe to Getting Real by Email.

