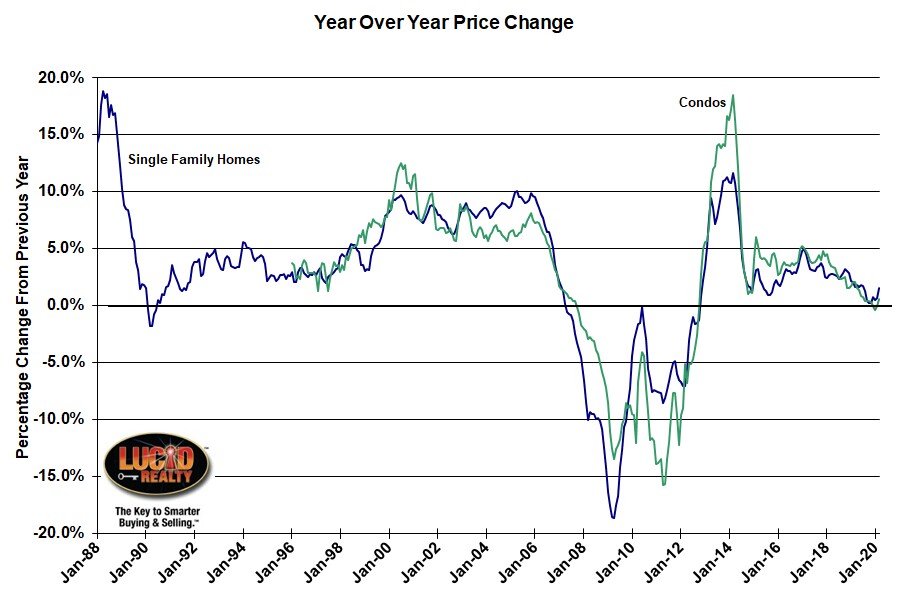
I may as well start with the good news. This morning S&P Dow Jones Indices released the March CoreLogic Case-Shiller Chicago area index of home prices and it shows single family home and condo/ townhome prices rising over the last year by the largest percentages in 8 months. If you look closely at the graph below you can see that.
So what’s the bad news? Well, the Chicago area’s annual home price appreciation has sucked so badly lately that it wasn’t hard to beat the last 7 months. All it took was for single family homes to rise by 1.5% and condo prices to rise by 0.6%. Meanwhile, all the other 18 metro areas covered by S&P Dow Jones (they actually cover 19 but Detroit was unavailable) did better than Chicago and the nation as a whole appreciated by 4.4%. The second worst metro area was New York with 2.1% growth.

Craig J. Lazzara, Managing Director and Global Head of Index Investment Strategy at S&P Dow Jones Indices, pointed out that this data does not yet reflect the impact of the Coronavirus shut down on economic activity:
Importantly, today’s report covers real estate transactions closed during the month of March. Housing prices have not yet registered any adverse effects from the governmental suppression of economic activity in response to the COVID-19 pandemic. As much of the U.S. economy remained shuttered in April, next month’s data may show a more noticeable impact.
Personally, I don’t even think that April indices will reflect the impact because homes that closed in April were mostly under contract in March and, if I recall, Case Shiller shows a 3 month average of home prices. I think we might see an impact in the May numbers.
Now to make matters worse the Federal Housing Finance Agency released their house price indices this morning also. They track 100 metro areas across the country. Anyone want to guess how Chicago ranked? No, not at the bottom but damn close to the bottom at #93. Sad.
Case Shiller Chicago Area Home Price Index By Month
For historical perspective on where home prices have been check out my graph below that shows the actual index levels along with a red trend line for single family homes that was based on the pre-bubble years. Single family home prices rose 1.5% from the previous month and condo prices rose by 1.8%, both of which are consistent with the typical seasonal increase.
You can see how prices are flattening out, how they haven’t recaptured the bubble highs, and how they are falling further and further behind the trendline. Single family home prices are 14.3% below the peak and condo prices are 7.1% below the peak. In fact, single family home prices are still lower than they were during the entire period from August 2004 – October 2008 and condos are still lower than their levels from June 2005 – November 2008. As for that trendline, single family home prices are now 28.7% below it.
Of course there’s been a lot of recovery from the depths of the housing crisis. Single family home prices have bounced back by 40.7% while condo prices are now 53.8% higher.
#CaseShiller #ChicagoHomePrices #HomePrices
Gary Lucido is the President of Lucid Realty, the Chicago area’s full service real estate brokerage that offers home buyer rebates and discount commissions. If you want to keep up to date on the Chicago real estate market or get an insider’s view of the seamy underbelly of the real estate industry you can Subscribe to Getting Real by Email using the form below. Please be sure to verify your email address when you receive the verification notice.
