When S&P Dow Jones CoreLogic released the September Case Shiller home price indices yesterday it became clear that home prices are falling across the nation, including the Chicago area. Actually, that was evident from last month’s release but I wasn’t about to react to a single month of data. However, as expected, the silver lining in this is that a lot of the markets that had been trouncing the Chicago area on the way up are now trouncing (in a bad way for them) Chicago on the way down.
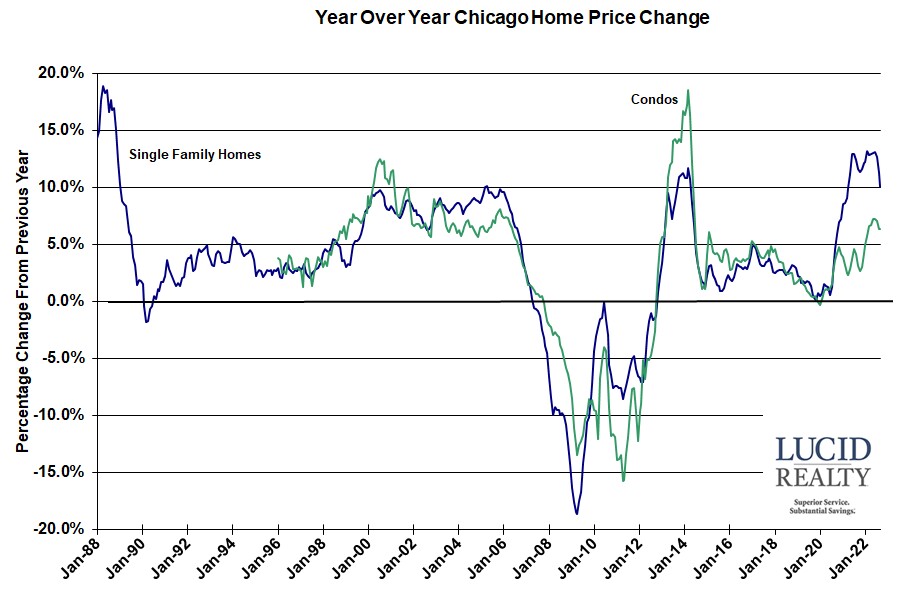
The year over year single family home price appreciation for the nation continues to fall, from 13.0% in August to 10.6% in September. The Chicago area’s one year appreciation rate, which is graphed below going back to 1988, fell to 10.0%. However, you’ll recall that the Chicago metro had been at or near the bottom of the pack for quite a while on the way up. Well, now 10 of the other 19 metro areas tracked by Case Shiller are showing lower one year appreciation rates than Chicago. Easy come, easy go.
As has been the case for some time now, condos and townhomes in the Chicago area registered a more modest 6.3% one year rate.

Craig J. Lazzara, Managing Director at S&P DJI, believes these price declines will continue for a while:
As the Federal Reserve continues to move interest rates higher, mortgage financing continues to be more expensive and housing becomes less affordable. Given the continuing prospects for a challenging macroeconomic environment, home prices may well continue to weaken.
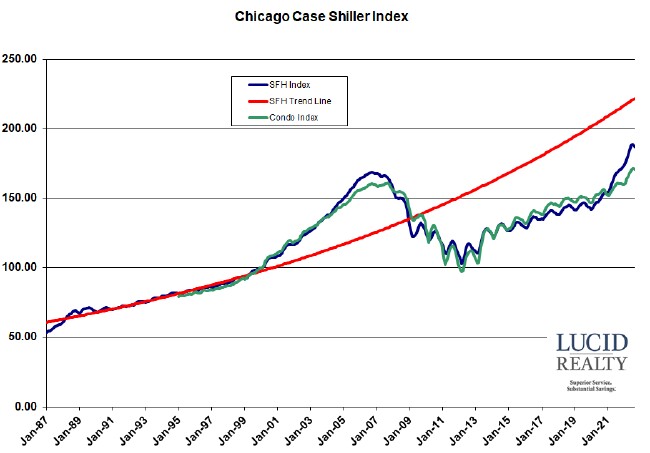
Case Shiller Chicago Area Home Price Index By Month
But we really can’t conclude anything definitive about short term trends from looking at year over year numbers. It’s the month to month numbers that tell us if prices are going down now and, in the graph below, it does look like the market has recently turned. Single family home prices in the Chicago area declined 0.6% from August to September while condo and townhome prices declined by 0.2%. So that gap between current prices and the long term trend line is growing now with single family home prices 15.8% below the trend line.
The only trick is there is quite a bit of seasonality in the data that makes it hard to interpret what’s going on. Fortunately, the Case Shiller folks provide us with seasonally adjusted numbers and it’s there that we’re seeing clear evidence of declining prices also.
Nevertheless, single family home prices are still 10.8% above their bubble peak and condo/ townhome prices are 6.1% above peak. Another way of looking at where we’ve been is that single family home prices have bounced 81.9% from their low while condo and townhome prices have bounced 75.6%.

