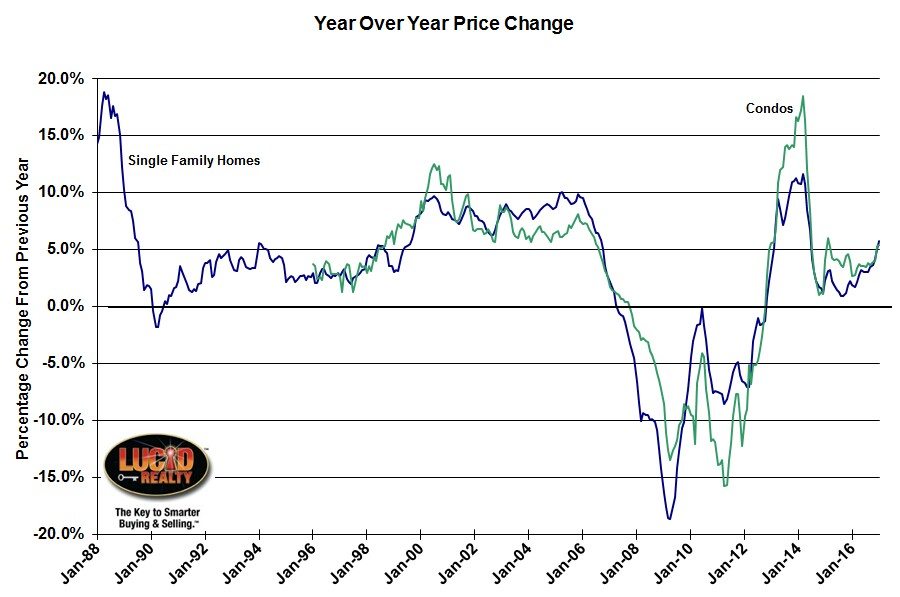
Well, it certainly took long enough. With the tight inventory levels in the Chicago area we kept wondering when home prices were going to reflect the supply/ demand reality. Finally, this morning’s release by S&P Down Jones Indices of the January Case Shiller home price index confirmed what should have been the inevitable: home prices in the metro area are starting to advance at a faster pace and we are even pulling ahead in the national rankings. The Case Shiller Chicago index’s one year gain was the highest in 31 months.
The graph below tracks these year over year price changes and you can see how they have recently surged. The January index for single family homes was up 5.8% over last year and the condo index was up 5.5%, a 23 month high in annual gains.
With these numbers Chicago is finally rising in the rankings of the 20 metro areas tracked by the Case Shiller home price indices. Forever we have been ranked 4th from the bottom (17th place) in terms of year over year home price appreciation but for January we rose to number 13 on the list.
As I have been pointing out for a few months now the seasonally adjusted data was suggesting that the Chicago area was beginning to show signs of improved performance relative to other metro areas. In fact, there are still positive indications on the basis of that metric with January up 1.3% from December, second only to Seattle which showed a 1.7% seasonally adjusted increase.
 At the national level prices were up 5.9% over last year and they are now 0.5% above the 2006 peak. David M. Blitzer, Managing Director and Chairman of the Index Committee at S&P Dow Jones Indices, commented on the potential negative impact of rising mortgage rates (personally, I don’t see rates rising any time soon) and how low inventory levels beget even lower inventory levels:
Housing and home prices continue on a generally positive upward trend. The recent action by the Federal Reserve raising the target for the Fed funds rate by a quarter percentage point is expected to add less than a quarter percentage point to mortgage rates in the near future. Given the market’s current strength and the economy, the small increase in interest rates isn’t expected to dampen home buying. If we see three or four additional increases this year, rising mortgage rates could become [a] concern.
While prices vary month-to-month and across the country, the national price trend has been positive since the first quarter of 2012. In February, the inventory of homes in the market represented 3.7 months of sales, lower than the long-term average of six months. Tight supplies and rising prices may be deterring some people from trading up to a larger house, further aggravating supplies because fewer people are selling their homes. The prices also hurt affordability as higher prices and mortgage rates shrink the number of households that can afford to buy at current price levels. At some point, this process will force prices to level off and decline – however we don’t appear to be there yet.
Case Shiller Chicago Home Price Index By Month
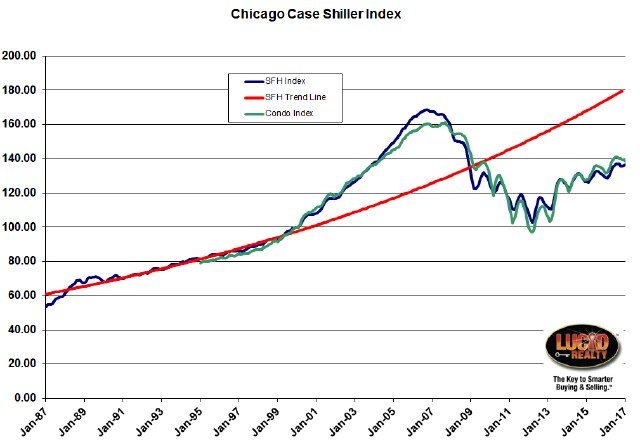
In January, single family home prices were up 0.2% from December while condo prices were actually down 0.6%. As you can see in the graph below that leaves the Chicago area with quite a way to go to get back to the 2006 peak levels with single family home prices still 19.1% below the peak and condo prices 13.9% below it. This situation is not that unusual among the major metro areas, though Chicago is worse off than many of the others, despite the fact that the nation as a whole is experiencing record home prices. For instance, the 20 city composite index is still 6.6% below peak.
The bottom line is that, on average, single family home prices are still below where they were during the entire 5 year period from December 2003 through December 2008 and condo prices are below where they were from April 2004 through February 2009. Nevertheless, we have recovered quite a bit from the bottom with single family homes up 32.8% and condo prices up 42.6%.
But suppose the bubble had never happened? Where would we expect home prices to be today? Well, that red line in the graph below represents the trajectory of single family home prices based upon pre-bubble appreciation rates and it sets an even loftier target than the peak prices. We are falling short of that by 24.5% to be exact and it’s not clear if we will ever close that gap. That line advances at a rate of 3.7% per year but we just clocked a 5.8% gain from last year so we are making some progress.
#ChicagoHomePrices #CaseShiller
Gary Lucido is the President of Lucid Realty, the Chicago area’s full service discount real estate brokerage. If you want to keep up to date on the Chicago real estate market, get an insider’s view of the seamy underbelly of the real estate industry, or you just think he’s the next Kurt Vonnegut you can Subscribe to Getting Real by Email using the form below. Please be sure to verify your email address when you receive the verification notice.
