This morning’s release of the Case Shiller home price index covers the three month period ending in April. This is a time period when prices are usually on the rise in Chicago and this year is no exception, though it was too hard to compete with last year’s hefty gains so the year over year numbers showed some decline relative to the recent record highs.
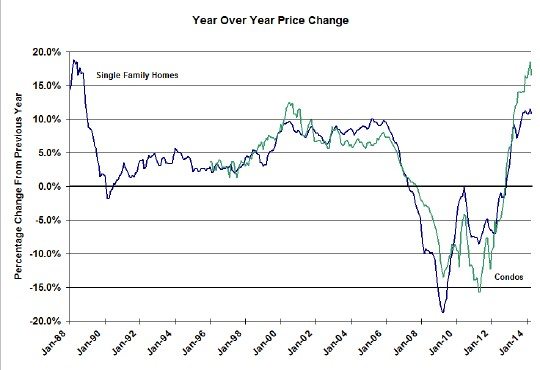
The graph below shows the year over year price changes going back to the beginning of the indices. The April single family home price index is now up 10.8% over last year, down from the record 11.5% last month, and the condominium index is up 16.6%, down from the record 18.5% also last month. As you can see these are still very strong numbers and if you look at the Case Shiller release you will see that Chicago is solidly in the middle of the pack of the 20 metro areas covered.
As I’ve pointed out these price increases have recently coaxed hesitant sellers out from under their beds but often at unrealistic prices that they soon give up on. Consequently, even though listing activity is up, inventories remain low, which is what is driving the prices up. Eventually the supply demand equation will balance and probably put a lid on further dramatic price increases.
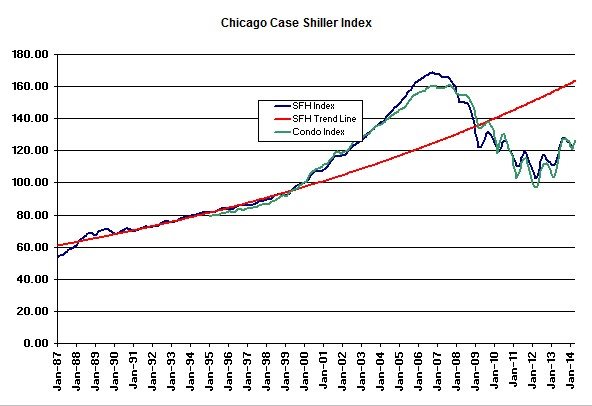
The graph below shows the long term history of the Chicago home price index along with the long term trend line in red. You can see how we are now in the upward sloping portion of the cycle. April single family home prices were up 2.0% from March and condominium prices were up 2.4%. With these increases we are back to the single family price levels reached in November 2002 on the way up and in February/ March 2009 on the way down. Those dates for condominiums are October 2002 and January/ February 2010 respectively.
Single family home prices have recovered a total of 22.6% from the bottom, though they are still 25.3% below the bubble peak, while condominium prices have recovered a total of 29.9% from the bottom, leaving them 21.5% below the peak. Looking at that long term trend line it’s apparent that we still have several years to go before catching up to it. Although we are gradually catching up to it we are still trailing it by 23.0%.
David M. Blitzer, Chairman of the Index Committee at S&P Dow Jones Indices, noted that the year over year home price increases have weakened at the national level and then went on to provide the following simultaneously optimistic and pessimistic outlook:
Near term economic factors favor further gains in housing: mortgage rates are lower than a year ago, the Fed is expected to keep interest rates steady until mid-2015 and the labor market is improving. However, housing is not back to normal: prices are being supported by cash sales, low inventories and declining foreclosure and REO sales. First time home buyers are not back in force and qualifying for a mortgage remains challenging. The question is whether housing will bounce back before the Fed begins to tighten sometime next year.
OK. I do NOT agree with that latter statement – at least as far as Chicago is concerned. At least our personal experience is that properties are selling quickly and there is no shortage of qualified borrowers. And the fact that lots of buyers are paying cash merely reflects the fact that there really isn’t anything better to do with that money right now. What’s wrong with lots of cash buyers?
If you want to keep up to date on the Chicago real estate market, get an insider’s view of the seamy underbelly of the real estate industry, or you just think I’m the next Kurt Vonnegut you can Subscribe to Getting Real by Email. Please be sure to verify your email address when you receive the verification notice.

