In this morning’s release of the Case Shiller Chicago home price index for November there is some good news: home prices in the area are still advancing – we’ve had just over 3 years of steady price gains over the previous year. And the pace of gains has been rising lately. But the bad news is that Chicago is still lagging the rest of the country. Of the 20 metro areas tracked by Case Shiller we are in last place for year over year price increases. That’s the 3rd month in a row that Chicago has had that distinction.
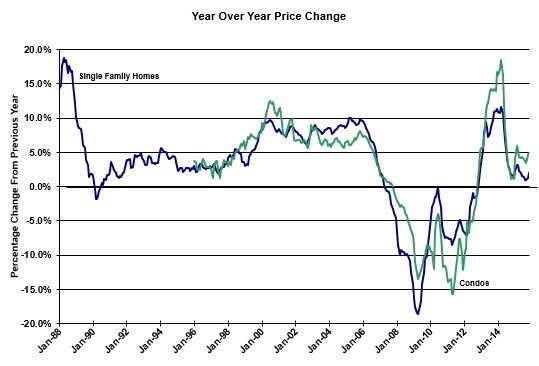
I have the graph of year over year price gains for single family homes and condos below. Single family home prices were up 2.0% over last year, which is the largest gain in 6 months. But compare that to gains of around 11% in San Francisco (of course), Denver, and Portland. However, Chicago condo prices were up a much more healthy 4.9%, which is the biggest gain in 8 months.
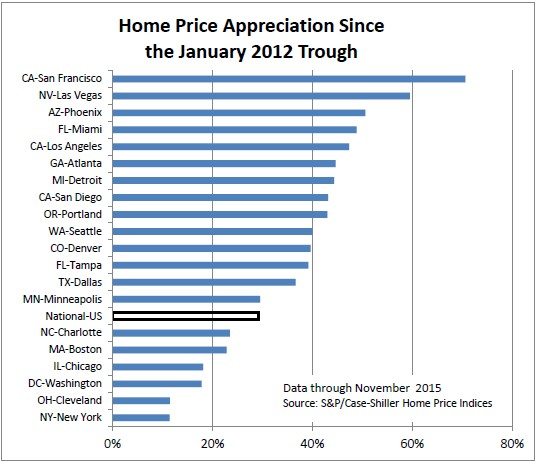
This month’s release also included a graph that shows how far each of the 20 metro areas have advanced since prices hit the bottom (at the national level) in January 2012. As you can see, by this metric Chicago is also near the bottom of the pack at just under 20%.
Compared to October Chicago single family home prices actually declined by 0.7% but that’s normal seasonality. In fact, if you take the seasonal influence out prices were actually up by 1.1% and that increase is actually in line with the gains seen by other metro areas. Condo prices were down 0.5% from October.
Chicago single family home prices have recovered a total of 26.9% from the bottom in March 2012. Note that we bottomed a little later than the nation as a whole…hence the discrepancy between our actual recovery and our recovery shown in the last graph. But we’re still near the bottom of the pack. Condo prices have recovered a much larger 38.3%. That leaves our single family home prices 22.6% below the bubble peak and condo prices 16.4% below the peak.
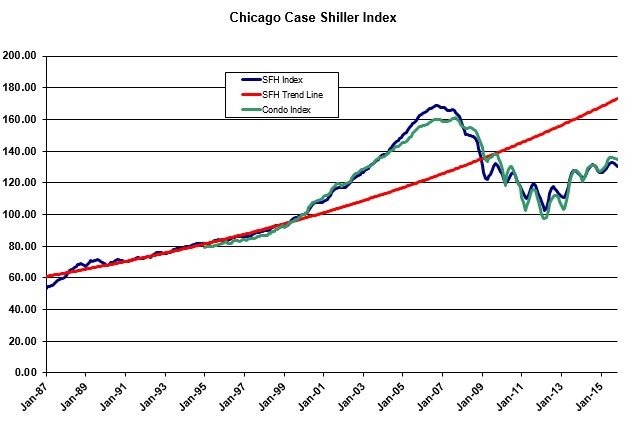
The graph below shows the entire available history of Chicago home prices according to Case Shiller along with a red trend line that depicts the average appreciation that we saw prior to the bubble. Clearly we have not returned to those days, where we typically saw 3.7% appreciation per year. And to put our current situation in more of a sad historic perspective single family home prices were higher than they are now during the entire period from May 2003 through January 2009. Condo prices were higher from September 2003 through November 2009.
Here is David M. Blitzer’s, Managing Director and Chairman of the Index Committee at S&P Dow Jones Indices, perspective on home prices at the national level:
Home prices extended their gains, supported by continued low mortgage rates, tight supplies and an improving labor market. Sales of existing homes were up 6.5% in 2015 vs. 2014, and the number of homes on the market averaged about a 4.8 months’ supply during the year; both numbers suggest a seller’s market. The consumer portion of the economy is doing well; like housing, automobile sales were quite strong last year…Three cities – Dallas, Denver and Portland OR – have reached new all-time highs; San Francisco is even with its earlier peak and Charlotte NC is less than one percent below its previous peak.
#CaseShiller #Realestate #HomePrices
Gary Lucido is the President of Lucid Realty, the Chicago area’s full service discount real estate brokerage. If you want to keep up to date on the Chicago real estate market, get an insider’s view of the seamy underbelly of the real estate industry, or you just think he’s the next Kurt Vonnegut you can Subscribe to Getting Real by Email using the form below. Please be sure to verify your email address when you receive the verification notice.


