The October Case Shiller Chicago area home price index came out last week from S&P Dow Jones CoreLogic along with the indices for the rest of the country and the previously identified pattern continues: across the country home prices are falling but the Chicago area seems to be falling slower than the rest of the country. This is evidenced by the fact that Chicago’s ranking for annual home price changes continues to rise. This month we ranked 9th out of 20 metro areas whereas last month we ranked 10th. This from a city that had been at the bottom of the pile a few short months ago.
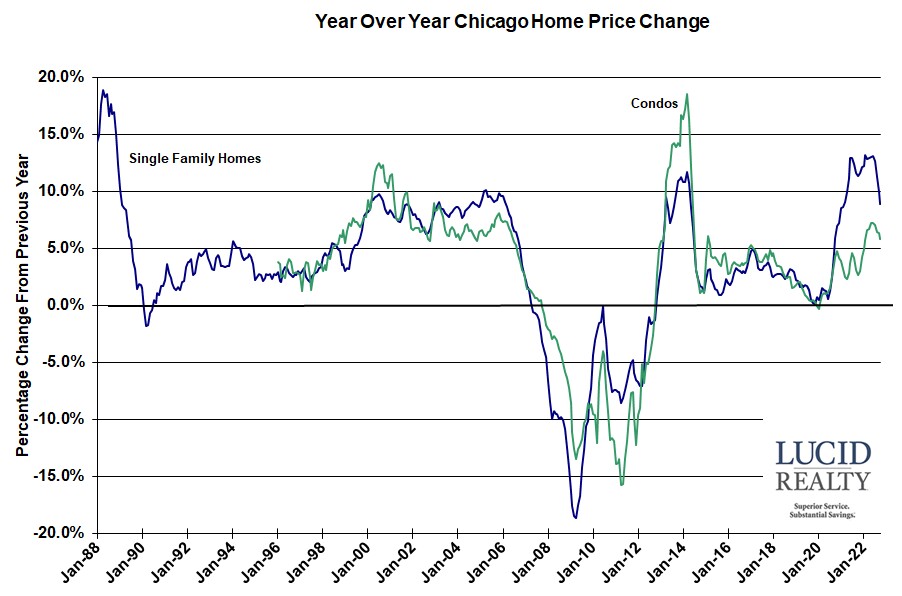
Consider that the Chicago area’s annual increase in single family home prices for October is now higher at 8.9% than the 10 and 20 city composite growth rates of 8.0% and 8.6% respectively. Meanwhile the national average barely beat the Chicago area at 9.2%. The Chicago area’s condo prices rose by 5.8%. All of these numbers are lower than they were the previous month and it should be noted that these numbers are roughly the lowest that they’ve been in 2 years.
No surprise, Craig J. Lazzara, Managing Director at S&P DJI, pretty much blames these declines on higher mortgage rates and thinks this trend will continue.
In the graph below you can see how dramatically the year over year growth rates are falling but at least prices are still higher than they were a year ago – for the time being.

Case Shiller Chicago Area Home Price Index By Month
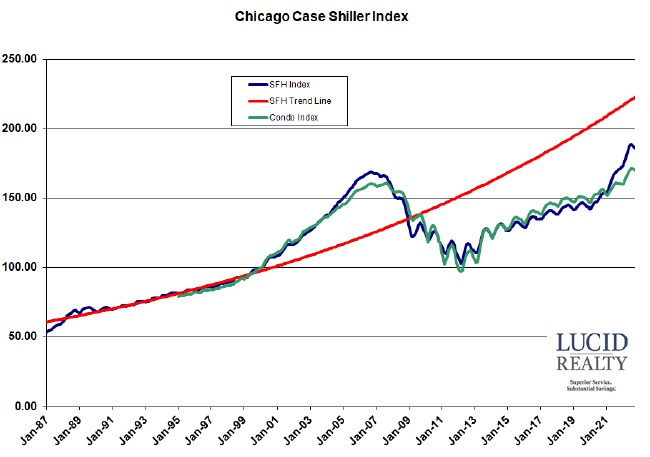
Actually, looking at the previous graph doesn’t really tell you that home prices are falling, just that home price growth is on the decline. But the graph below makes the decline in home prices clearer because it shows the actual monthly values of the indices and you can see how prices have turned in the last few months. Single family home prices fell another 0.5% in October while condo prices fell 0.7%. Of course, there’s a lot of seasonality in these numbers but the decline is confirmed by looking at the seasonally adjusted numbers.
There is also that long term single family trend line based upon the pre-bubble period to contend with. Chicago single family home prices had finally been closing the gap with that trend line but now that gap is widening again. Prices are now 16.5% below trend but at least they are 10.2% above the bubble peak, having gained 80.8% from the market bottom. Condo prices on the other hand are 5.4% above the peak and have jumped 74.5% from their bottom.

