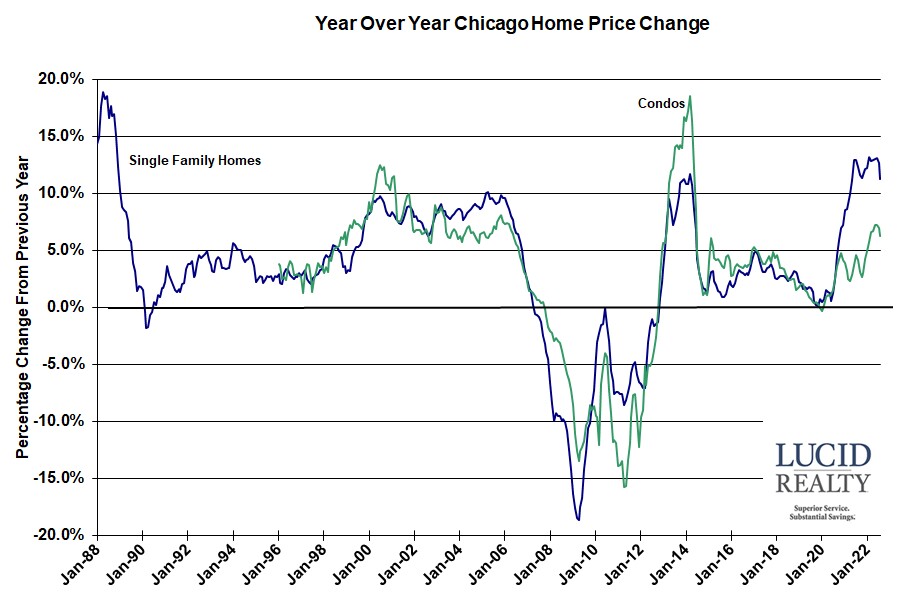
This morning’s release of the August Case Shiller home price indices continues to support the notion that Chicago area home price growth is less vulnerable to a weaker real estate market precipitated by rising mortgage rates. Or at least the data is consistent with that notion. The report by S&P Dow Jones CoreLogic showed year over year single family home price appreciation for the nation dropping from 15.6% in July (they don’t mention that originally they said it was 15.8% in July but who’s paying attention?) to a mere 13.0% in August. It’s important to note that there is no sign of prices actually dropping yet.
Craig J. Lazzara, Managing Director at S&P DJI, pointed out that:
…the -2.6% difference between those two monthly rates of change is the largest deceleration in the history of the index (with July’s deceleration now ranking as the second largest). We see similar patterns in our 10-City Composite (up 12.1% in August vs. 14.9% in July) and our 20-City Composite (up 13.1% in August vs. 16.0% in July). Further, price gains decelerated in every one of our 20 cities. These data show clearly that the growth rate of housing prices peaked in the spring of 2022 and has been declining ever since.
…Despite the ongoing deceleration, August’s housing prices remain well above year-ago levels in all 20 cities.
…As the Federal Reserve moves interest rates higher, mortgage financing becomes more expensive and housing becomes less affordable. Given the continuing prospects for a challenging macroeconomic environment, home prices may well continue to decelerate.
On the other hand Chicago area single family home price appreciation slowed down to 11.3% year over year from 12.7% in July. That’s not as big of a drop as seen in the other areas. What’s interesting is that now 7 metro areas have fallen below Chicago in the rankings. If you will recall Chicago had been at the very bottom of the 20 metro areas tracked for quite some time. And condo prices in the Chicago area appreciated by 6.3%, down from 7.0% in July.

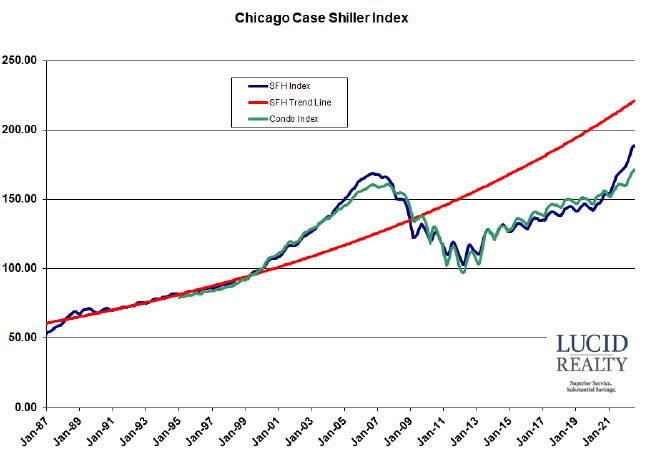
Case Shiller Chicago Area Home Price Index By Month
If you look at the month over month numbers for the Chicago area you will see a decline but that’s normal at this time of the year. The data is seasonal, which you can see in the squiggly lines in the graph below. So single family home prices declined by 0.5% while condo prices declined by 0.2%.
The graph shows how much prices have risen from the bubble peak – 11.5% for single family homes and 6.2% for condos. Also, you can see the dramatic rise from the depths of the housing market crash with single family home prices up 83.0% and condo prices up 75.8%.
And that red line is a trend line I created for single family home prices based on pre-bubble data. Chicago area prices had fallen way behind that trend line and were staying there for years – until the pandemic changed the game. Now the gap has shrunk considerably – prices are only 15.0% below trend.

