Low home inventory levels are finally starting to have a significant impact on home prices. The only mystery at this point is what took it so long? The December Case Shiller home price index just came out from S&P Corelogic for the 20 metro areas they track and the nation as a whole and it shows home prices gaining at a 30 month record annual rate. Even the Case Shiller Chicago area home price index hit a 30 month record appreciation rate.
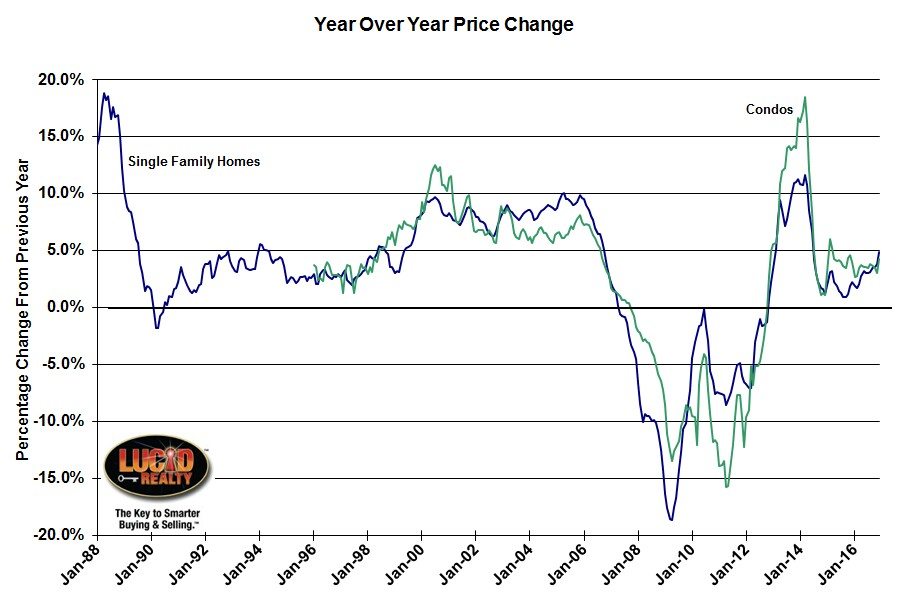
If you look closely at the graph for the Chicago metro area below you can see that the year over year home price changes have been slowly drifting steadily higher for many months now and we just registered our 50th consecutive month of annual gains. In December single family home prices surged 4.9% over the previous year while condo prices jumped 4.3%. For condos that’s only a 13 month record appreciation rate. As I like to point out when the appreciation rate exceeds your after tax mortgage interest rate you are living in your home for free….well, except for property taxes and maintenance. But you get my point.
But if you want to look for the dark cloud in all of this I’ll point out that Chicago is still tied with Phoenix for 4th from last place in terms of annual home price appreciation. The nation as a whole gained 5.8% and Portland and Seattle both showed double digit gains.
However, there is actually a bright spot as well. On a seasonally adjusted basis December Chicago home prices were up from November by more than any other city (1.5% vs. 1.4% for Seattle). Now, you can’t really conclude anything from a single month but this is definitely a good sign. If this were to continue that would mean that eventually Chicago would rise in the rankings of annual appreciation rates.

One factor behind rising home prices is low inventory. While sales of existing single family homes passed five million units at annual rates in January, the highest since 2007, the inventory of homes for sales remains quite low with a 3.6 month supply. New home sales at 555,000 in 2016 are up from recent years but remain below the average pace of 700,000 per year since 1990. Another factor supporting rising home prices is mortgage rates. A 30-year fixed rate mortgage today is 4.2% compared to the 6.4% average since 1990.
Blitzer also commented on whether or not these home price increases should be seen as normal:
With all 20 cities seeing prices rise over the last year, questions about whether this is a normal housing market or if prices could be heading for a fall are natural. In comparing current home price movements to history, it is necessary to adjust for inflation. Consumer prices are higher today than 20 or 30 years ago, while the inflation rate is lower. Looking at real or inflation-adjusted home prices based on the S&P CoreLogic Case-Shiller National Index and the Consumer Price Index, the annual increase in home prices is currently 3.8%. Since 1975, the average pace is 1.3%; about two-thirds of the time, the rate is between -4% and +7%. Home prices are rising, but the speed is not alarming….Another indicator that home price levels are normal can be seen in the charts of Seattle and Portland OR. In the boom-bust of 2005-2009, prices of low, medium, and high-tier homes moved together, while in other periods, including now, the tiers experienced different patterns.
Case Shiller Chicago Home Price Index By Month
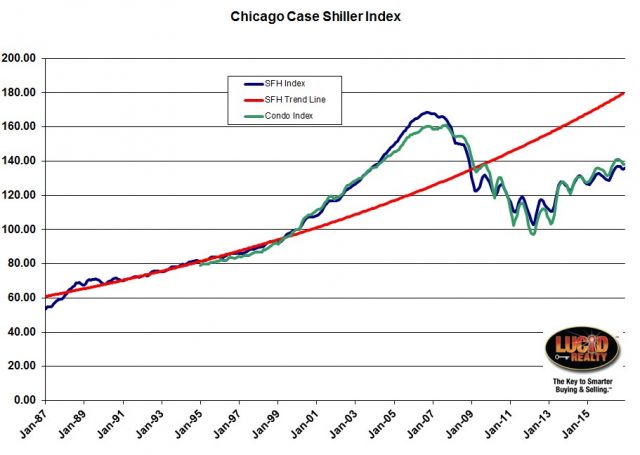
The graph below shows the longer term trend in the Case Shiller Chicago home price index. The December index for single family homes was up 0.5% from November while the condo index was down 0.1%. As you can clearly see we are nowhere near our peak price level from the bubble years. In fact, single family home prices are still 19.3% below the peak and condo prices are 14.2% below peak. And to make matters worse that leaves single family home prices lower than they were during the entire period from November 2003 to December 2008 and condo prices lower than they were from April 2004 to February 2009.
However, the bubble peak prices are actually lower than where we would have expected home prices to be at this point if they had just continued to rise at their pre-bubble average rate. That’s what the red trend line in the graph below represents and we’re still lagging that by an even greater 24.5%.
From the bottom single family home prices have recovered 32.3% while condo prices have gained 42.1%.
#ChicagoHomePrices #CaseShiller
Gary Lucido is the President of Lucid Realty, the Chicago area’s full service discount real estate brokerage. If you want to keep up to date on the Chicago real estate market, get an insider’s view of the seamy underbelly of the real estate industry, or you just think he’s the next Kurt Vonnegut you can Subscribe to Getting Real by Email using the form below. Please be sure to verify your email address when you receive the verification notice.
