After yesterday’s release of the Dow Jones S&P CoreLogic February Case Shiller home price index I needed a catchier headline than the usual “Home Prices Are Slowing Down” and “The Chicago Area Was Slow To Begin With”. I decided to focus instead on the unusual circumstances of home price appreciation in all 3 California metro areas tracked by Case Shiller slowing down so much that they’ve actually fallen behind the Chicago area for the first time that I’ve noticed.
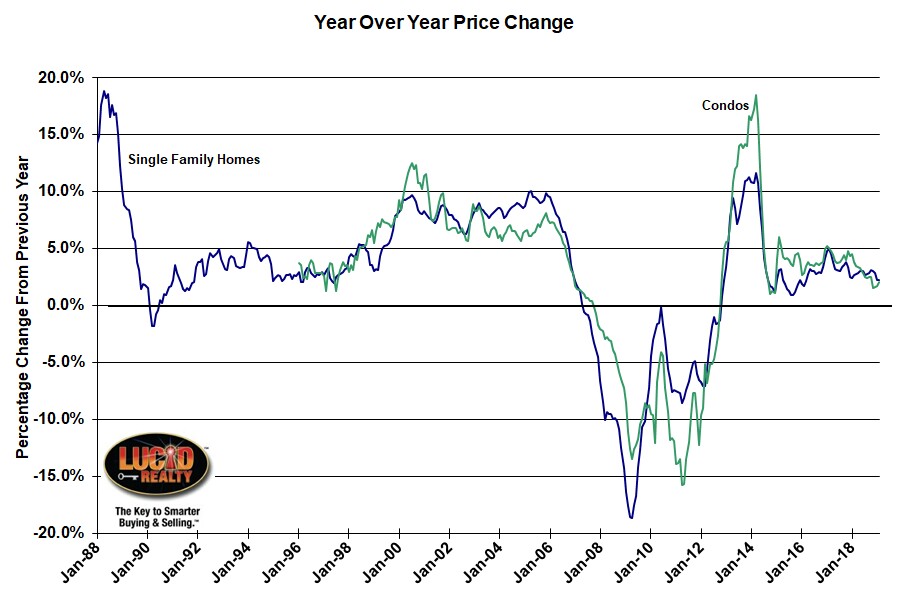
That puts the Chicago area at 4th from the bottom out of 20 in terms of home price appreciation, a rise in ranking from 3rd from the bottom last month. On a year over year basis single family home prices rose by just 2.2% in the last year in the Chicago area, which is the slowest growth in almost 3 years. But we can at least take comfort in the fact that home prices in our area have now risen for 76 consecutive months.
Condo prices rose by 2.1% in the last year, which is actually the highest rate in the last 4 months. I have the full history of our price appreciation graphed below for both single family homes and condos.
The story is much the same for the nation as a whole. Year over year single family home price appreciation fell to 4.0% in February from 4.3% in January – and January was almost a 4 year low. If you look at just the 20 metro areas tracked by Case Shiller you will see that they averaged only a 3.0% gain.

In the release David M. Blitzer, Managing Director and Chairman of the Index Committee at S&P Dow Jones Indices, provided some perspective on the geographical differences in home price appreciation:
The largest year-over-year price increase is 9.7% in Las Vegas; last year, the largest gain was 12.7% in Seattle. Regional patterns are shifting. The three California cities of Los Angeles, San Francisco and San Diego have the three slowest price increases over the last year. Chicago, New York and Cleveland saw only slightly larger prices increases than California. Prices generally rose faster in inland cities than on either the coasts or the Great Lakes. Aside from Las Vegas, Phoenix, and Tampa, which saw the fastest gains, Atlanta, Denver, and Minneapolis all saw prices rise more than 4% — twice the rate of inflation.
Case Shiller Chicago Area Home Price Index By Month
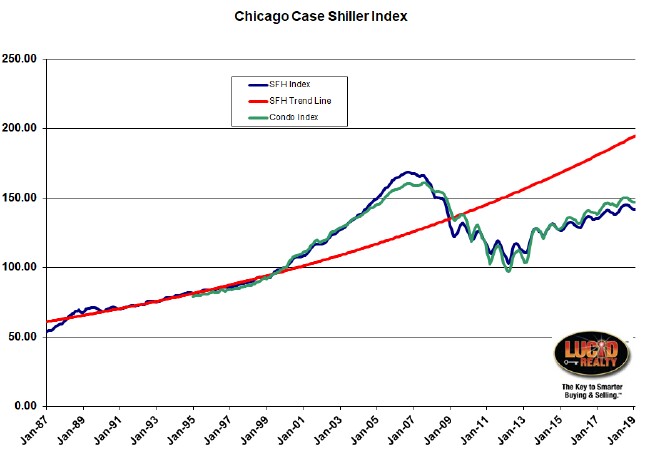
In the graph below I show the actual monthly levels of the Case Shiller Chicago area index for single family homes and condos going back to 1987. The February index for single family homes was essentially unchanged from January while the condo index fell by 0.2%, which is not all that surprising considering that home prices normally fall at that time of year.
As you can see from the graph, we are nowhere near reaching our all time highs of the housing bubble peak. Single family prices are still 15.9% below their highs and condo prices are still 8.7% below the high. In fact, single family prices are still below where they were during the entire period from May 2004 – November 2008 and condo prices are lower than they were from April 2005 – November 2008. And if you compare the current level of our home prices to the pre-bubble red trend line you will find that we are short by 27.3%, with the gap widening over time.
But at least we have recovered quite a bit from the bottom. Single family home prices have risen by 37.9% and condo prices have risen by 51.1%.
#CaseShiller #HomePrices #ChicagoHomePrices
Gary Lucido is the President of Lucid Realty, the Chicago area’s full service real estate brokerage that offers home buyer rebates and discount commissions. If you want to keep up to date on the Chicago real estate market or get an insider’s view of the seamy underbelly of the real estate industry you can Subscribe to Getting Real by Email using the form below. Please be sure to verify your email address when you receive the verification notice.
