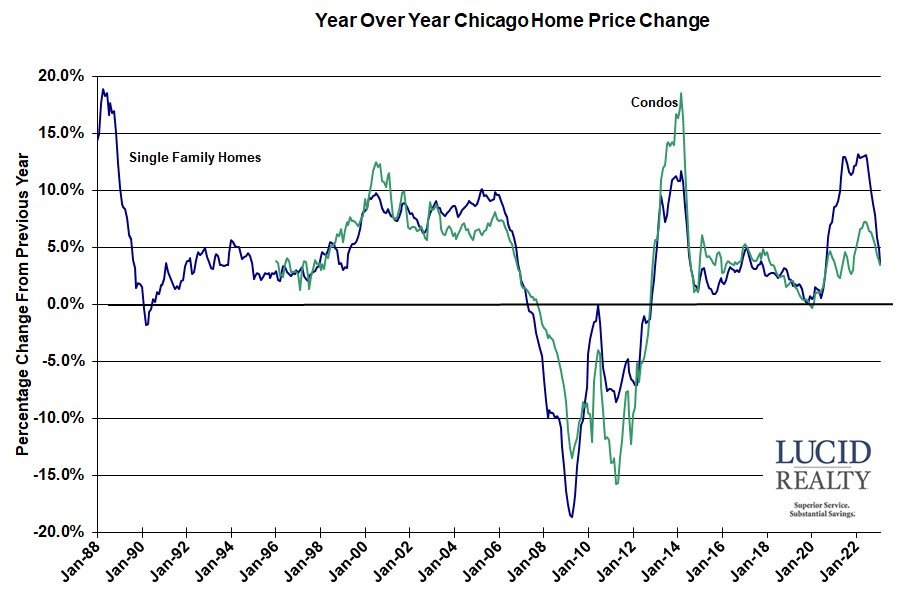
The February Case Shiller Chicago area home price index released this morning by Dow Jones S&P CoreLogic showed a continuation of the decline in year over year appreciation, with single family prices now only 3.6% higher than last year and condo and townhome prices only 3.4% higher. However, that 3.6% number is higher than the national average of 2.0% and Chicago is now tied with New York for 6th place – up from 7th place last month – among the 20 metro areas covered by the Case Shiller index.
The graph below shows the monthly year over year appreciation rates going back to January of 1988 and note that February is the 124th consecutive month of gains. However, appreciation hit its lowest level in 30 months.

Case Shiller Chicago Area Home Price Index By Month
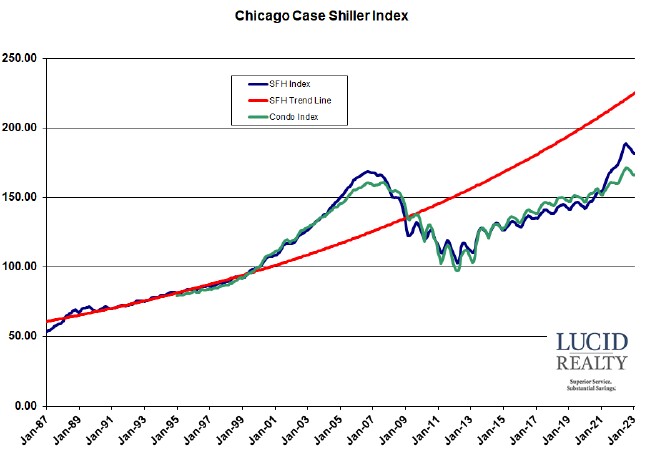
The graph below shows the monthly values of the Case Shiller Chicago index along with a red trend line based on pre-bubble data. Single family home prices in February were flat from January while condo and townhome prices fell 0.1%. This probably marks the end of the seasonal decline, with several of the metro areas actually showing gains relative to January.
In the graph you can see how home prices have been lagging the trend line for a really long time but the recent surge in prices started to close the gap a bit. However, the recent downturn has widened it again to 19.4%. At least single family homes are still 7.7% above the bubble peak and condo prices are 3.1% higher. Of course, the recovery from the bottom is more impressive with a 76.7% bounce for single family homes and a 70.6% gain for condos and townhomes.

