When S&P Dow Jones CoreLogic released the July Case Shiller home price indices for the Chicago area and the rest of the nation a couple of weeks ago I was in the process of moving. Therefore, I’m a bit late in getting around to reporting on that data but it just so happened to be one of the more interesting releases in recent memory so it’s worth discussing.
In short, home prices are still up from a year ago but they aren’t up as much as they were a few months ago because higher mortgage rates are freaking buyers out. At the national level home prices were 15.8% higher in July than they were a year ago but that’s down from 18.1% in June. In fact, 12 of the 20 metro areas actually saw price declines from June to July.
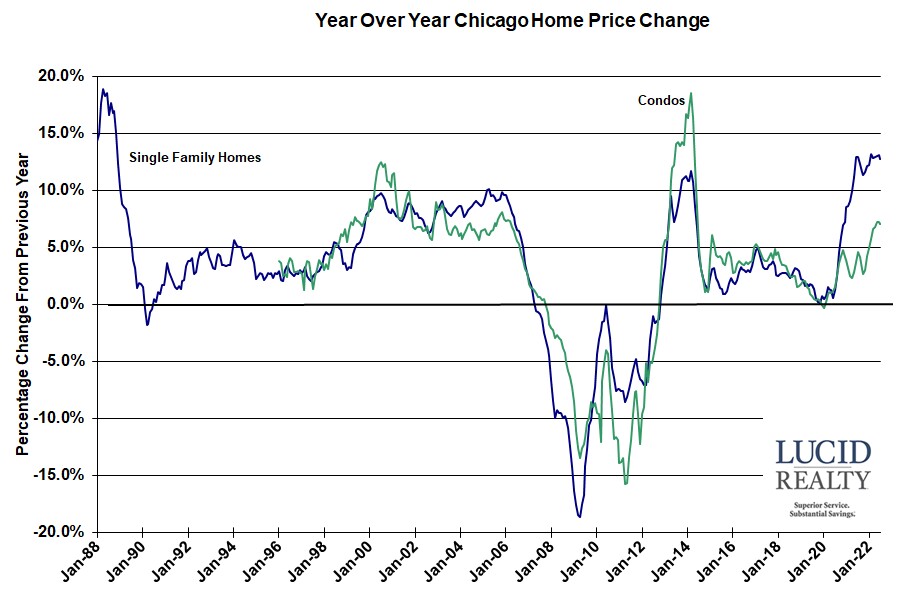
The Chicago area did not see a decline and its price appreciation is holding up rather well considering what happened elsewhere. As I and others have speculated, since we didn’t experience the crazy appreciation of the rest of the country over the last few years maybe our prices will prove to be more robust now. July single family home prices were up 12.7% from last year which is not that far off the recent high. That allowed Chicago to rise once again in the rankings to 6th from the bottom. Condo prices were up 7.0% – also close to the recent high in price appreciation.
The graph below shows the Chicago area’s home price appreciation over time with 117 consecutive months of gains from the previous year, including 16 months of double digit gains for single family homes.

Craig J. Lazzara, Managing Director at S&P DJI, noted that the deceleration in home price appreciation from June to July was the highest ever recorded for the indices and he expects higher mortgage rates and the threat of a recession to keep a lid on home price appreciation for the foreseeable future.
Case Shiller Chicago Area Home Price Index By Month
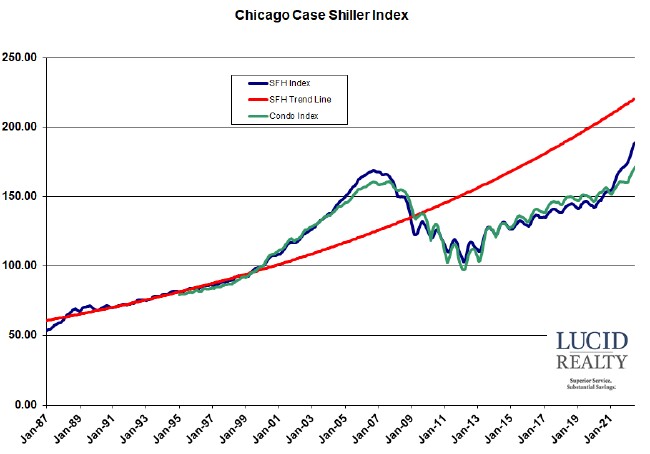
The monthly Chicago area index values are graphed below along with the red trend line for single family home prices based on prices before the housing bubble. Single family home prices rose by 0.7% from June while condo prices were up 0.8%. Note how we had been really lagging that trend line for years but with the recent uptick in prices the gap is down to a 14.3% shortfall.
Home prices are also putting more distance between them and the previous housing bubble peak with single family prices now 12.1% above peak and condo prices 6.4% above peak. From the bottom of the crash single family homeowners on average are up 83.9% while condo owners are up 76.1%.

