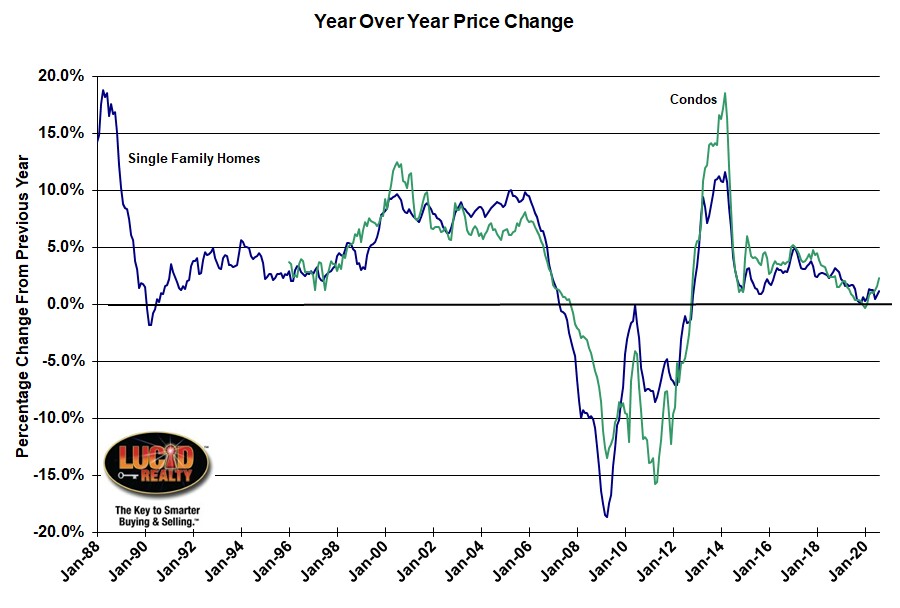
S&P Dow Jones released their August CoreLogic Case Shiller home price indices this morning and it shows the same pattern in home price appreciation that we’ve been observing for a while. First, the nation’s home price appreciation is picking up speed – probably due to tighter inventory coming out of the initial pandemic lockdown. For the 12 months ending in August national average home prices rose by 5.7% vs. 4.8% for the 12 months ending in July. And the Chicago area also experienced faster home price appreciation but the acceleration was not as great and it still leaves Chicago in last place among the 20 metro areas covered by the indices. The Case Shiller Chicago area index appreciated by only 1.2% for the 12 months ending in August vs. 0.9% for the 12 months ending in July. Compare that to second to last place New York that experienced a 2.8% increase and first place Phoenix with 9.9% appreciation.
Chicago area condo prices also accelerated their price growth with a 2.3% year over year gain vs. 1.6% for July. That’s interesting because Chicago condo inventory has been rising but the bulk of inventory arrived a little later in the year so watch out.
Craig J. Lazzara, Managing Director and Global Head of Index Investment Strategy at S&P Dow Jones Indices, put these price gains in historic perspective relative to pandemic related issues:
A trend of accelerating increases in the National Composite Index began in August 2019 but was interrupted in May and June, as COVID-related restrictions produced modestly-decelerating price gains. We speculated last month that the accelerating trend might have resumed, and August’s results easily bear that interpretation. The last time that the National Composite matched August’s 5.7% growth rate was 25 months ago, in July 2018. If future reports continue in this vein, we may soon be able to conclude that the COVID-related deceleration is behind us.
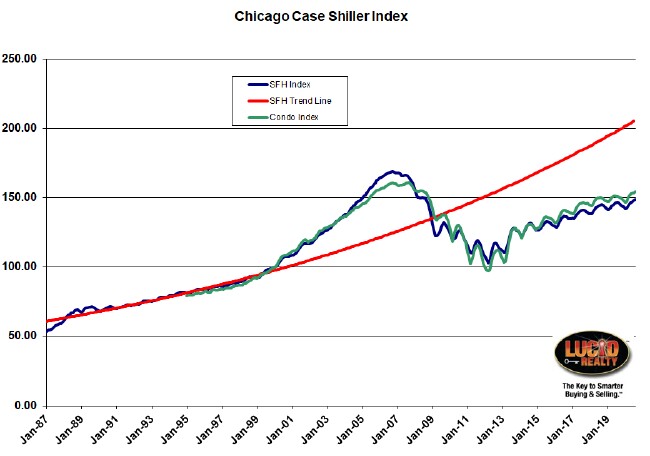
Case Shiller Chicago Area Home Price Index By Month
The graph below shows the Case Shiller Chicago area home price indices for single family homes and condos by month going back to 1987 along with a red trendline for single family homes based upon pre-bubble history. There is a pretty strong seasonal pattern and right now the August data is approaching the peak for the year. Single family home prices rose by 0.4% from July while condo prices rose by 0.5%.
From the very bottom of the bubble crash there has been a substantial recovery. Single family home prices have risen by 44.5% and condo prices have risen by 58.4%.
Unfortunately though, we still haven’t recovered to the highs of the bubble peak. Single family prices are still 11.9% below that peak and condo prices fall short by 4.3%. In fact, single family home prices are still below the entire period from December 2004 – September 2008 while condo prices are below where they were during the October 2005 – August 2008 period.
Nor have we caught up to the very nice trend line we were on before the bubble happened. Single family home prices fall short by 27.8% and the gap is widening given Chicago’s slow home price appreciation.
#ChicagoHomePrices #CaseShiller #HomePrices
Gary Lucido is the President of Lucid Realty, the Chicago area’s full service real estate brokerage that offers home buyer rebates and discount commissions. If you want to keep up to date on the Chicago real estate market or get an insider’s view of the seamy underbelly of the real estate industry you can Subscribe to Getting Real by Email using the form below. Please be sure to verify your email address when you receive the verification notice.

