Yesterday S&P Dow Jones released the CoreLogic Case Shiller home price indices for June and it’s just more of the same stuff I’ve been whining about for months, if not years. The Case Shiller Chicago area home price index highlights a real estate market whose home prices are seriously lagging the rest of the country.
According to the report the nation’s home prices rose by 4.3% over the last year but the Chicago area’s home prices grew at the slowest rate among the top 20 metro areas – only 0.6%. The second worst metro area was the San Francisco area at 1.4%. Compare all that to Phoenix, which was at the top of the pack with 9.0% growth.
The Federal Housing Finance Agency produces their own set of home price indices for the top 100 metro areas which gives us a broader perspective. Anyone want to guess how the Chicago area ranks in terms of annual appreciation? That would be #93 out of 100.
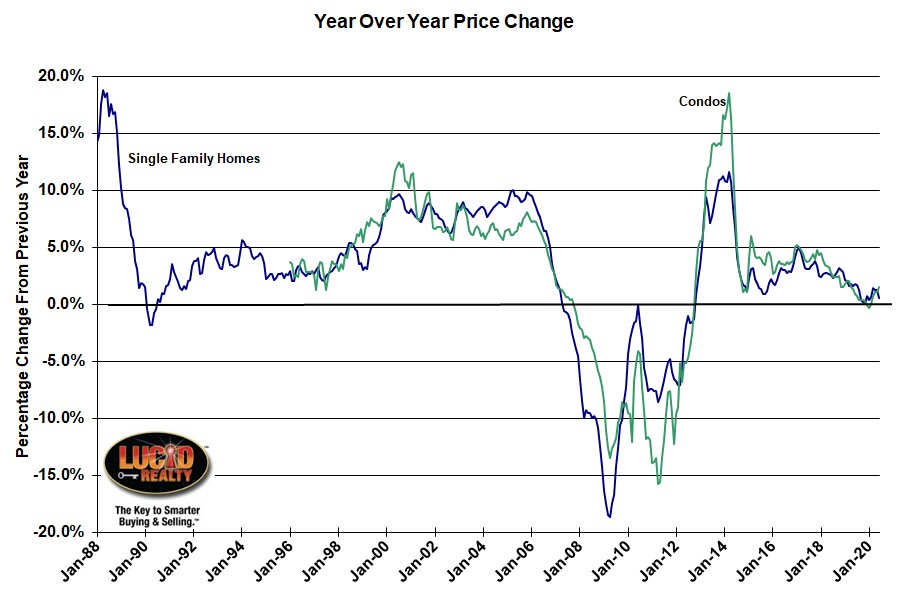
To make matters worse annual Chicago area home price appreciation has been coming in below 2% for 16 consecutive months now. Chicago area condo prices have been doing a little bit better, registering 1.6% growth in the last year, which is the highest reading in 15 months. The graph below provides historic perspective on the annual appreciation rates for both housing types.
Case Shiller Chicago Area Home Price Index By Month
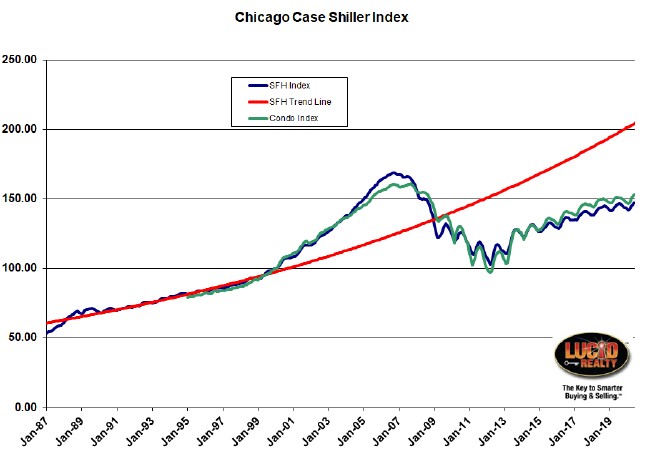
The graph below shows you where single family and condo prices have been in the Chicago area along with a red trend line which I established based upon pre-bubble single family home prices. June’s single family home prices were 0.1% higher than May’s and condo prices were 0.5% higher, partly due to seasonal factors.
Clearly, after the bubble popped home prices started rising much slower than they had been before the bubble. It’s so bad that the gap between the trend line and current prices is 28.1%. So bad that single family home prices are still 12.8% below the bubble peak while condo prices are 4.6% lower. So bad that the average single family home purchased between October 2004 – September 2008 is still underwater as is the average condo purchased between September 2005 – August 2008.
But at least there has been a sizable 43.1% bounce off the bottom for single family homes and a 57.8% bounce for condos.
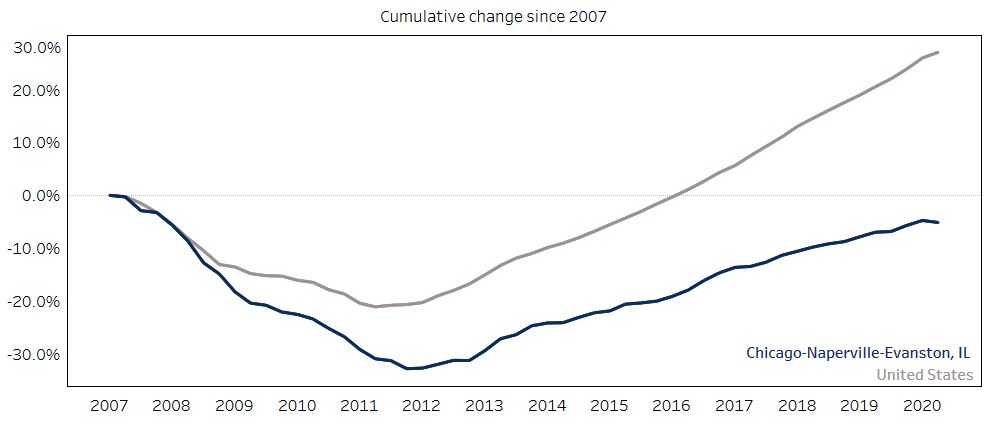
Now that I’ve shown you the history of Chicago area home prices let’s look at how they compare to the rest of the nation over a longer time horizon. From the FHFA site I referenced above I pulled the graph below which looks at the 1st quarter of 2007 through the 2nd quarter of 2020. Cumulatively, Chicago home prices are down 5.1%, compared to US home prices in the aggregate which are up 27.1% – a 32.2% gap. That’s kinda a big difference. But I guess it helps make Chicago more affordable than the rest of the country. That’s a good thing, right?
#ChicagoHomePrices #CaseShiller #HomePrices
Gary Lucido is the President of Lucid Realty, the Chicago area’s full service real estate brokerage that offers home buyer rebates and discount commissions. If you want to keep up to date on the Chicago real estate market or get an insider’s view of the seamy underbelly of the real estate industry you can Subscribe to Getting Real by Email using the form below. Please be sure to verify your email address when you receive the verification notice.


