S&P Dow Jones released their December CoreLogic Case Shiller home price indices this morning. The year over year price increase for the nation’s single family homes moved into double digit territory with a 10.4% gain, which is the largest increase in 7 years. That was up from a 9.5% increase for November so price appreciation continues to accelerate. And, since this is a December report, it also represents the price gain for the entire year.
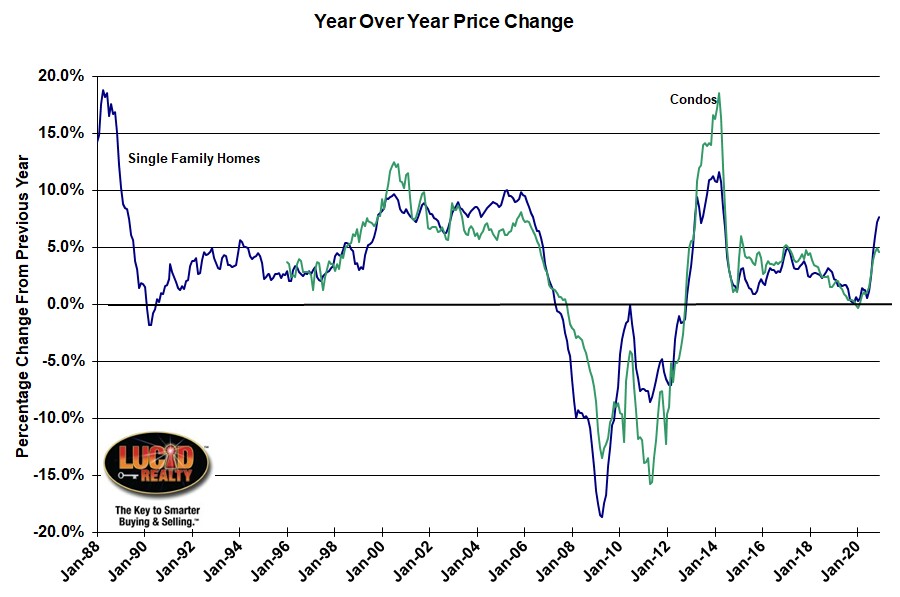
The Case Shiller Chicago area index for single family homes rose by 7.7% in 2020. Now, I’m not going to complain about our home prices rising by 7.7% in a year but, unfortunately, that’s the lowest appreciation rate among 19 metro areas that they track. The second lowest appreciation rate? That would be Las Vegas with a 7.9% gain.
I’ve got these year over year home price appreciation rates for Chicago graphed below and it includes a line for condo prices, which grew by 4.6% last year. That’s actually down slightly from the 5.0% gain in November.

Craig J. Lazzara, Managing Director and Global Head of Index Investment Strategy at S&P DJI, commented on the trend in the nation’s home price appreciation:
The trend of accelerating prices that began in June 2020 has now reached its seventh month and is also reflected in the 10- and 20-City Composites (up 9.8% and 10.1%, respectively). The market’s strength continues to be broadly-based: 18 of the 19 cities for which we have December data rose, and 18 cities gained more in the 12 months ended in December than they had gained in the 12 months ended in November.
As COVID-related restrictions began to grip the economy in early 2020, their effect on housing prices was unclear. Price growth decelerated in May and June, and then began a steady climb upward, and December’s report continues that acceleration in an emphatic manner. 2020’s 10.4% gain marks the best performance of housing prices in a calendar year since 2013. From the perspective of more than 30 years of S&P CoreLogic Case-Shiller data, December’s year-over-year change ranks within the top decile of all reports.
These data are consistent with the view that COVID has encouraged potential buyers to move from urban apartments to suburban homes. This may indicate a secular shift in housing demand, or may simply represent an acceleration of moves that would have taken place over the next several years anyway.
Case Shiller Chicago Area Home Price Index By Month
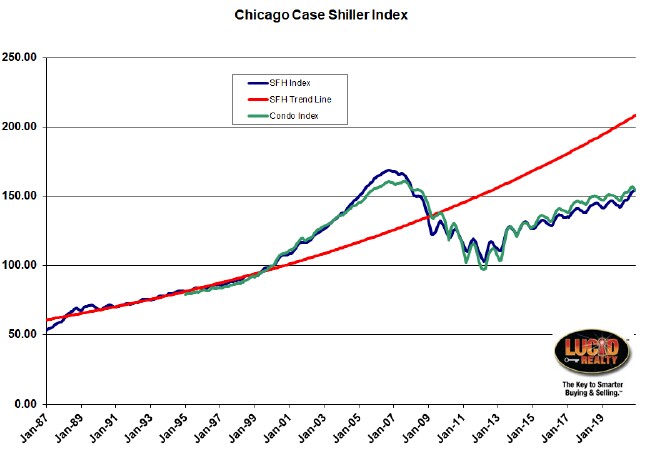
This next graph shows the underlying Chicago Case Shiller indices plotted over time so that you can see where home prices are relative to the past. The red line is a trend line I created based upon pre-bubble price history for single family homes. The recent gains buck the normal seasonal drop in home prices. December single family home prices rose by 0.3% instead of falling like they normally do, although condo prices did fall by 1.2%.
Despite recent strong gains we still haven’t recovered to peak prices. Single family home prices are still 8.4% below the peak while condo prices are 4.2% below the peak. To put it another, dramatic, way single family home prices are still lower than they were during the entire period from May 2005 – February 2008 while condo prices are still lower than they were during the October 2005 – July 2008 period.
Don’t get me wrong. We’ve made a lot of progress from the bottom, with single family home prices rising 50.3% and condo prices bouncing 58.6%. On the other hand, if you use the red trend line as your benchmark home prices are depressed 25.9%.
#ChicagoHomePrices #CaseShiller #HomePrices
Gary Lucido is the President of Lucid Realty, the Chicago area’s full service real estate brokerage that offers home buyer rebates and discount commissions. If you want to keep up to date on the Chicago real estate market or get an insider’s view of the seamy underbelly of the real estate industry you can Subscribe to Getting Real by Email using the form below. Please be sure to verify your email address when you receive the verification notice.
