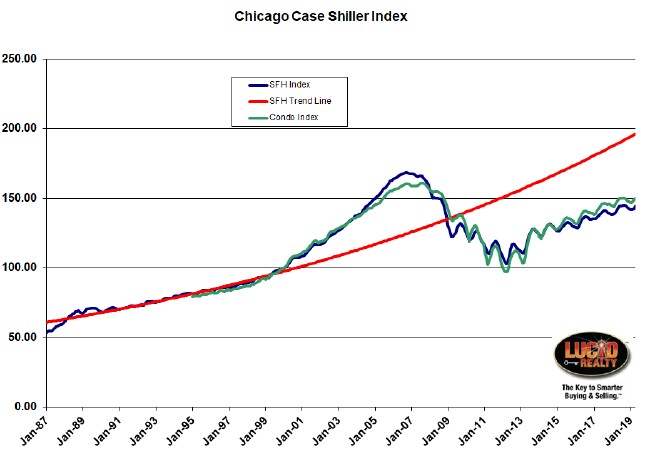
The May Dow Jones S&P CoreLogic Case Shiller home price indices came out this morning, showing once again that home price appreciation is slowing even more across the country. And, sadly, Chicago area home price growth dropped another notch in the rankings – to 4th from the bottom with only a 1.6% year over year increase in single family home prices. That’s the lowest appreciation rate in 43 months. Chicago area condo prices rose only 1.4% from last year, which is a 53 month low. See the graph below for the historic trend in these two metrics.
Chicago home prices reflect the slowing growth pattern of the rest of the nation where prices rose by 3.4% in the last year, down from 3.5% in April. The Case Shiller 20 city composite index showed even slower growth of only 2.4%, down from 2.5% in April. Surprisingly, Seattle home prices actually went down by 1.2% from last year. We haven’t seen home prices decline in a major metro area like this in years.
Philip Murphy, Managing Director and Global Head of Index Governance at S&P Dow Jones Indices, discussed the variation in home price gains between markets:
Though home price gains seem generally sustainable for the time being, there are significant variations between YOY rates of change in individual cities. Seattle’s home price index is now 1.2% lower than it was in May 2018, the first negative YOY change recorded in a major city in a number of years. On the other hand, Las Vegas and Phoenix, while cooler than they were during 2018, remain quite strong at 6.4% and 5.7% YOY gains, respectively. Whether negative YOY rates of change spread to other cities remains to be seen; for now, there is still substantial diversity in local trends. Nationally, increasing housing supply points to somewhat weakened demand, but the fact that seven cities experienced stronger YOY price gains in May than they did in April suggests an underlying resiliency that may mitigate the risk of overshooting to the downside at the national level.
Case Shiller Chicago Area Home Price Index By Month
According to the Case Shiller Chicago index single family home and condo prices both rose by 0.8% from April. The graph below shows the historic levels of these indices and you can see the seasonal pattern which generally produces monthly increases at this time of year. You can also see how the general direction of price increases has slowed and how the increases are trending slower than the red trendline which I generated based on Chicago’s pre-bubble appreciation rate. Currently, single family prices fall short of that trendline by 26.1% and that gap is only widening.
At the current rate it’s going to take quite a while before Chicago area home prices catch up to their bubble peak. Single family home prices are still falling short by 13.7% and condo prices are 6.0% shy of the top. In fact, single family home prices are still lower than they were during the entire stretch from September 2004 – October 2008 while condo prices are lower than the July 2005 – October 2008 period.
Nevertheless, home prices have made a really nice recovery from the bottom of the crash. Single family prices are up 41.5% while condo prices have risen by 55.5%.
#CaseShiller #ChicagoHomePrices #HomePrices
Gary Lucido is the President of Lucid Realty, the Chicago area’s full service real estate brokerage that offers home buyer rebates and discount commissions. If you want to keep up to date on the Chicago real estate market or get an insider’s view of the seamy underbelly of the real estate industry you can Subscribe to Getting Real by Email using the form below. Please be sure to verify your email address when you receive the verification notice.

