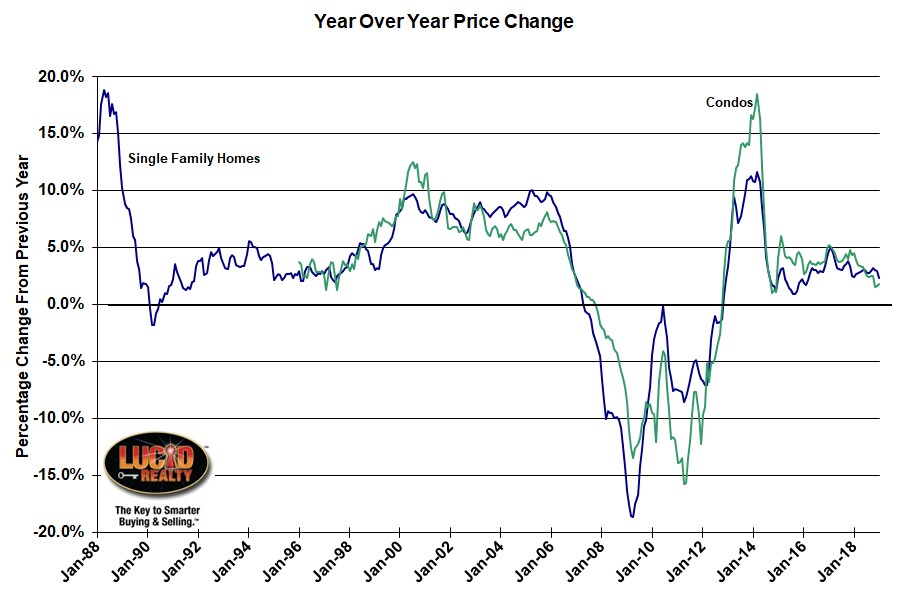
The folks at Dow Jones S&P CoreLogic released their much awaited January Case Shiller home price index for the nation and the Chicago area (along with 19 other metro areas) this morning. The big headline making the rounds today is that for the nation as a whole year over year home price gain of 4.3% was the lowest appreciation rate since April 2015. Meanwhile, Chicago’s Case Shiller index registered a mere 2.4% annual rate of appreciation, which is the slowest rate we’ve seen in a year. However, it does represent the 75th consecutive month of year over year price increases.
And when you rank the 20 metro areas by price appreciation the Chicago area remains third from the bottom. What’s really interesting though is that California home price growth has slowed down quite a bit with San Francisco and San Diego now occupying the two lowest spots in the rankings, below Chicago. Just last week the Wall Street Journal ran an article on how California companies are either leaving the state or expanding outside the state because of a lack of housing, proving two Econ 101 lessons that politicians should learn: 1) demand > supply => higher prices and 2) the cure for high prices is high prices.
Chicago condo prices rose 1.8% from last year, which is a slight uptick from the previous two months. As you can see in the graph below condo prices have been rising slower than single family home prices for the last 8 months.
David M. Blitzer, Managing Director and Chairman of the Index Committee at S&P Dow Jones Indices noted that:
In 16 of the 20 cities tracked, price gains were smaller in January 2019 than in January 2018. Only Phoenix saw any appreciable acceleration. Some cities where prices surged in 2017-2018 now face much smaller increases: in Seattle, annual price gains dropped from 12.8% to 4.1% from January 2018 to January 2019. San Francisco saw annual price increases shrink from 10.2% to 1.8% over the same time period.
Mortgage rates are as important as prices for many home buyers. Mortgage rates climbed from 3.95% in January 2018 to a peak of 4.95% in November 2018. Since then, rates have dropped to 4.28% as of mid-March.
Case Shiller Chicago Area Home Price Index By Month
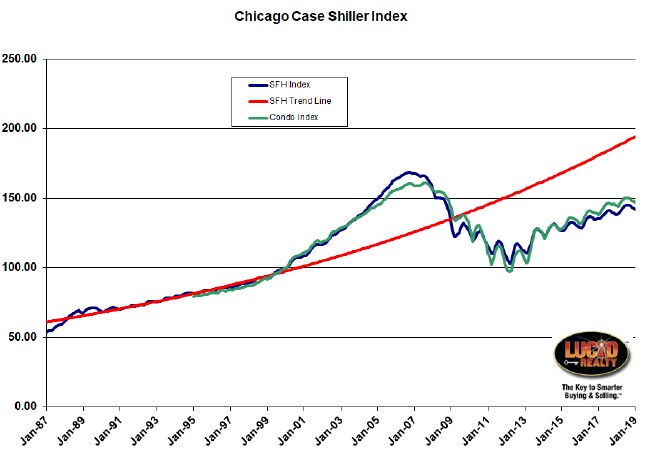
The graph below provides a historical perspective on where Chicago home prices have been and you can plainly see the seasonality in the wiggles. As January is part of the seasonal downturn it’s no surprise that single family home prices fell 0.5% from December and condo prices fell 0.1%.
We’ve made steady but slow progress in recovering from the bottom after the housing bubble. Single family home prices have risen a total of 38.0% while condo prices have recovered 51.4%. Yet, we have not returned to the “predicted” level of the red trendline which I created based upon pre-bubble single family home prices. We are falling below that benchmark by 27.0%.
And we certainly have not yet returned to the prices that we peaked at during the bubble. Single family home prices fall short by 15.9% and condo prices fall short by 8.5%. Another way to look at our inadequacies compared to that period is to consider that single family home prices are still below where they were during the entire period from May 2004 – November 2008 and condo prices are lower than they were from April 2005 – November 2008.
#ChicagoHomePrices #HomePrices #CaseShiller
Gary Lucido is the President of Lucid Realty, the Chicago area’s full service real estate brokerage that offers home buyer rebates and discount commissions. If you want to keep up to date on the Chicago real estate market or get an insider’s view of the seamy underbelly of the real estate industry you can Subscribe to Getting Real by Email using the form below. Please be sure to verify your email address when you receive the verification notice.

