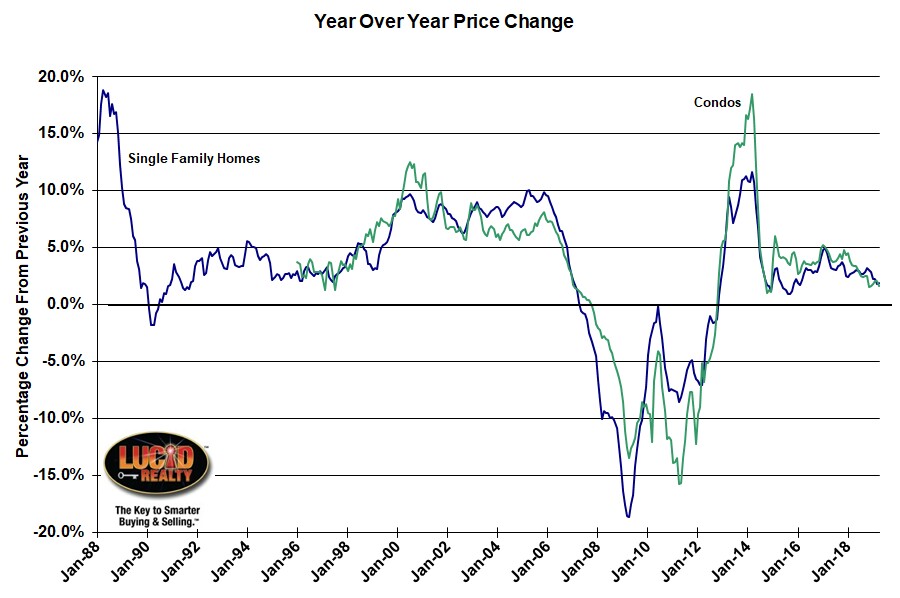
According to the April Case Shiller Home price indices released this morning by Dow Jones S&P CoreLogic another of the 20 metro areas tracked – Seattle – fell below the Chicago area in the rankings of year over year single family home price appreciation. This left Chicago 5th from the bottom. In general home price appreciation for the nation slowed from March while the Chicago area had mixed results. Based on the Case Shiller Chicago indices single family home prices rose 1.9% in the last year, up from 1.8% in March, but condo prices rose by only 1.6%, which is down from 2.1% in March. In fact, 1.6% is the bottom of the condo price appreciation range for the last 52 months.
Seattle dropping below Chicago is an interesting phenomenon because they went from registering a 13.1% annual appreciation rate a year ago to now registering 0 gain over the last year. What the hell happened?
The nation’s home prices did better than the Chicago area on average with a 3.5% gain but that continued the downward trend in appreciation over the last several months. March was 3.7%. And the 20 city composite index only registered a 2.5% gain.
Philip Murphy, Managing Director and Global Head of Index Governance at S&P Dow Jones Indices, tried to make sense of the slowing rate of appreciation and pointed out that lower mortgage rates are not goosing prices:
The national average 30-year fixed mortgage rate rose from below 4% in late 2017 to briefly reaching almost 5% by the latter part of 2018. Peak YOY changes in the 20-City Composite coincided with the upward turn in mortgage rates during the first quarter of 2018. In 2019, mortgage rates reversed course again and the 30-year fixed mortgage rate is again under 4%, yet the YOY house price moderation that coincided with the 2018 uptick in rates has not changed course. Other industry statistics are consistent with this observation. For example, the national supply of housing is trending upward and suggesting weaker demand. Perhaps the trend for the moment is toward normalization around the real long run average annual price increase. Comparing the YOY National Index nominal change of 3.5% to April’s inflation rate of 2.0% yields a real house price change of 1.5% – edging closer to the real long run average of 1.2% cited by David Blitzer last month.
Case Shiller Chicago Area Home Price Index By Month
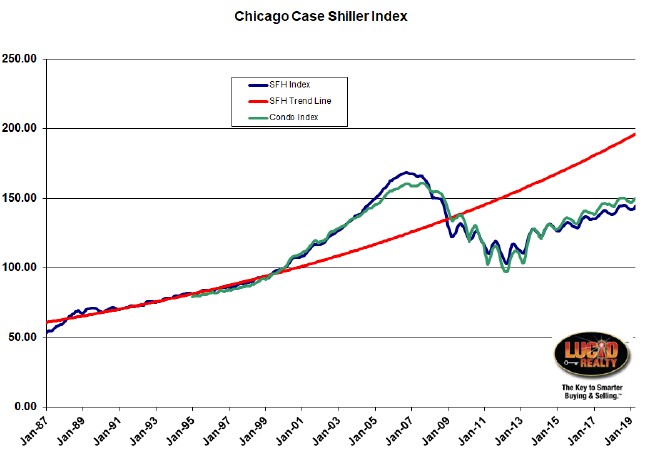
The historic Case Shiller Chicago area index values going back to 1987 are graphed below. Single family home prices rose 1.2% from March while condo prices rose by 0.9%. As you can see in the graph we are a long way off still from hitting those housing bubble highs. Single family home prices are still 14.4% shy of the top and condo prices are falling short by 6.7%.
Here is another way to look at where we are relative to the bubble days. Single family home prices are currently lower than they were during the entire period from July 2004 – October 2008 while condo prices are lower than the period from June 2005 – October 2008.
The graph below also contains a red trendline that I created based on the pre-bubble pricing data. We are now 26.4% below that trendline and the gap is widening since we are on a slower growth path now.
However, we have made a nice recovery from the bottom of the housing crisis. Single family home prices are up 40.4% and condo prices are up 54.4% from those depths.
#CaseShiller #ChicagoHomePrices #HomePrices
Gary Lucido is the President of Lucid Realty, the Chicago area’s full service real estate brokerage that offers home buyer rebates and discount commissions. If you want to keep up to date on the Chicago real estate market or get an insider’s view of the seamy underbelly of the real estate industry you can Subscribe to Getting Real by Email using the form below. Please be sure to verify your email address when you receive the verification notice.

