Dow Jones S&P CoreLogic released the May Case Shiller home price indices for the nation and the 20 largest metro areas a few hours ago. While home prices for the nation as a whole appreciated by 6.4% over the last year and the 20 metro areas appreciated by 6.5%, the Case Shiller Chicago area home price index is telling a much bleaker story. Although we moved out of last place among the 20 metro areas, our home prices rose by only 3.3% in the last year. Last place honors went to Washington DC with 3.1% appreciation. At the other extreme San Francisco, Las Vegas, and Seattle continue to clock double digit gains.
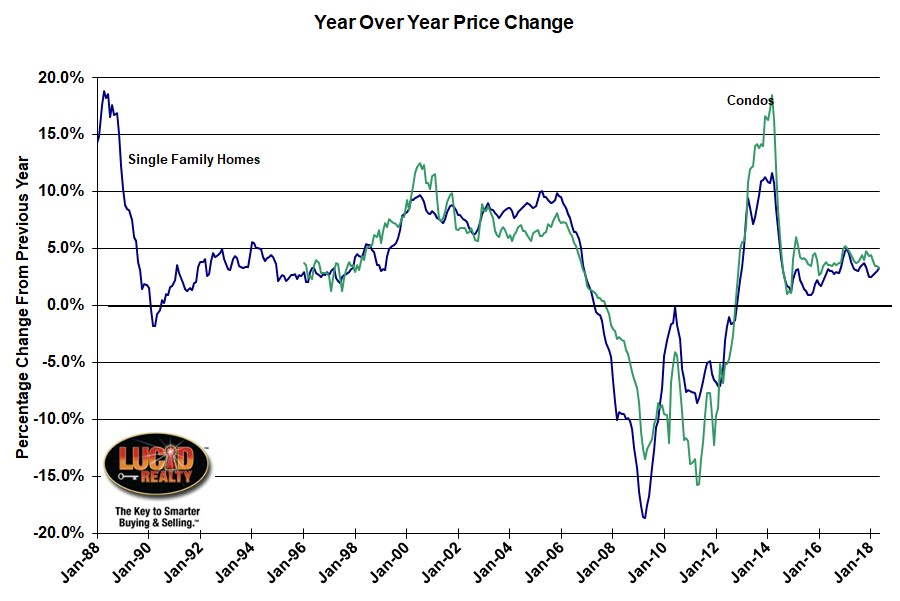
Nevertheless, as shown in the graph below, May was the 67th consecutive month of year over year gains for the Chicago area. Our single family home price appreciation rate has been gradually rising the last 4 months but simultaneously our condo price appreciation has been falling. With condos also hitting a 3.3% annual appreciation rate in May, the two lines just crossed and for condos that’s the lowest appreciation rate in 27 months.

Listening to David M. Blitzer, Managing Director & Chairman of the Index Committee at S&P Dow Jones Indices, you would never know how poorly the Chicago area is doing relative to the rest of the country:
Home prices continue to rack up gains two to three times greater than the inflation rate. The year-over-year increases in the S&P CoreLogic Case-Shiller National Index have topped 5% every month since August 2016. Unlike the boom-bust period surrounding the financial crisis, price gains are consistent across the 20 cities tracked in the release; currently, the range of the largest to smallest price change is 10 percentage points compared to a 20 percentage point range since 2001, and a 25 percentage point range between 2006 and 2009. Not only are prices rising consistently, they are doing so across the country.
But he also sounds a cautionary note regarding the housing market:
Continuing price increases appear to be affecting other housing statistics. Sales of existing single family homes – the market covered by the S&P CoreLogic Case-Shiller Indices – peaked last November and have declined for three months in a row. The number of pending home sales is drifting lower as is the number of existing homes for sale. Sales of new homes are also down and housing starts are flattening. Affordability – a measure based on income, mortgage rates and home prices – has gotten consistently worse over the last 18 months. All these indicators suggest that the combination of rising home prices and rising mortgage rates are beginning to affect the housing market.
So he’s trying to blame slowing home sales on rising prices and rising mortgage rates and doesn’t even mention the potential role of low inventory levels. Of course, we are hard pressed to explain the low inventory levels given the higher prices. One theory is that with higher mortgage rates there is a disincentive to move at the expense of a higher mortgage rate.
Case Shiller Chicago Area Home Price Index By Month
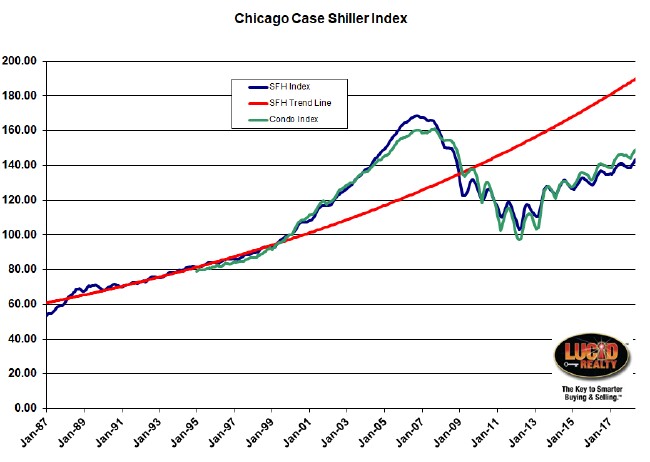
The graph below shows the history of the Case Shiller indices for both single family homes and condos going back to 1987. I recently discovered some additional, older data that I might be able to piece together to move that graph back to 1970. I will post that as soon as I put that together.
The May index for single family homes was up 1.3% from April, the biggest one month increase in 2 years, but the condo index was up only 0.9%. Nevertheless, the condo index has been on a positively divergent path from single family home prices for some time.
As you can see in the graph, unlike much of the rest of the country, we still have not recaptured the levels from the bubble peak. Single family home prices are still down 14.8% from that peak and condo prices are closing in but still down 7.3%. Another way to look at it is that single family home prices are still lower than they were during the entire period from July 2004 – October 2008 and condo prices are still lower than they were from June 2005 – November 2008.
In addition, the red line in the graph below is a trendline that I extrapolated from looking at the single family home price appreciation rate prior to the housing bubble. Unfortunately, since exceeding it and crashing below it, we have never recovered. We are currently 24.3% below it.
Nevertheless, we have made a lot of progress in recovering from the depths of despair. Single family home prices are up 39.7% from that bottom and condo prices are up 53.3%.
#ChicagoHomePrices #CaseShiller
Gary Lucido is the President of Lucid Realty, the Chicago area’s full service discount real estate brokerage. If you want to keep up to date on the Chicago real estate market, get an insider’s view of the seamy underbelly of the real estate industry, or you just think he’s the next Kurt Vonnegut you can Subscribe to Getting Real by Email using the form below. Please be sure to verify your email address when you receive the verification notice.
