I’ve always wanted to use the word penultimate and I had to come up with a more unique way of saying once again that the Case Shiller Chicago home price index for March released today has us in second to last place among 20 metro areas that they track. That ranking is based upon year over year home price gains. You can find the entire S&P Dow Jones release here: Home Prices Continue Steady Gain In March According To The S&P Case Shiller Home Price Indices.
For the nation as a whole singly family home prices are up 5.2% over the last year, with 3 cities experiencing double digit increases as high as 12.3% (Portland). Coming in last was Washington DC with a measly 1.5% but Chicago was not much better with only a 1.9% increase. However, at least that’s a tad better than last month’s 1.8% increase over the previous year.
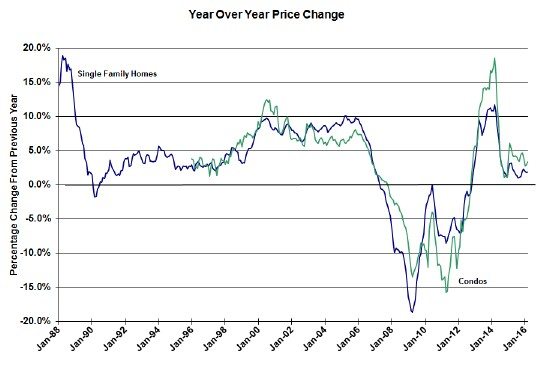
In the graph below I track the year over year increases in Chicago for both single family home and condo prices going back to January 1988. We’ve been in positive territory for almost 3 1/2 years now and the gains in condo prices have been outpacing single family homes during much of this period. In March condo prices were up 3.4% over last year.

David M. Blitzer, Managing Director & Chairman of the Index Committee at S&P Dow Jones Indices, commented on the factors that are driving home prices across the nation:
Home prices are continuing to rise at a 5% annual rate, a pace that has held since the start of 2015. The economy is supporting the price increases with improving labor markets, falling unemployment rates and extremely low mortgage rates. Another factor behind rising home prices is the limited supply of homes on the market. The number of homes currently on the market is less than two percent of the number of households in the U.S., the lowest percentage seen since the mid-1980s.
Price movements vary across the country. The Pacific Northwest and the west continue to be the strongest regions. Seattle, Portland, Oregon and Denver had the largest year-over-year price increases. These cities also saw some of the largest declines in unemployment rates among the 20 cities included in the S&P/Case-Shiller Indices. The northeast and upper mid-west regions were at the other end of the ranking. The four cities with the smallest year-over-year prices gains were Washington DC, Chicago, New York, and Cleveland. The unemployment rates in Chicago and Cleveland rose from March 2015 to March 2016.
That’s an extremely interesting statistic about only 2% of the households having homes for sale. Even if we factor it for the homeownership rate of approximately 64% that still means that it’s only around a 3% turnover rate, which implies that people are staying in their homes for 33 years on average?!?!?!?!
Case Shiller Chicago Home Price Index By Month
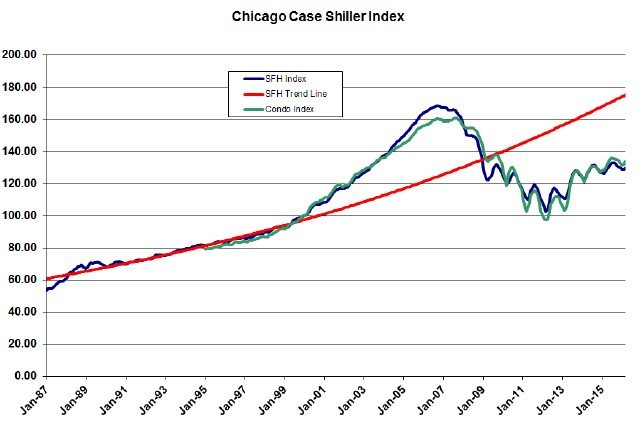
I’ve plotted the Chicago index going back to 1987 for single family homes and back to January 1995 for condos in the graph below. There is also a red trend line that represents the average pre-bubble growth rate in the single family home index. The current gap with that trend line currently stands at 25.9% below trend, with no sign of that gap ever closing, but keep in mind that this represents an average for the entire Chicago metro area. Individual results may vary.
With the release of the March numbers we once again have returned to the time of the year when home prices rise (you can see the seasonal effect in the squiggles in the lines below), though condo prices actually rose last month for the first time since winter. Single family home prices were up 1.0% from February while condo prices were up 1.6%.
With these gains single family home prices have recovered 26.5% from the bottom and condo prices have recovered 38.0%. Nevertheless, home prices are still well below the peak – 22.9% for single family homes and 16.6% for condos. However, to put it in even more dramatic terms, single family homes are still below where they were during the entire period from May 2003 – January 2009 and condo prices are still below the entire period from September 2003 – November 2009.
#ChicagoHomePrices #CaseShiller
Gary Lucido is the President of Lucid Realty, the Chicago area’s full service discount real estate brokerage. If you want to keep up to date on the Chicago real estate market, get an insider’s view of the seamy underbelly of the real estate industry, or you just think he’s the next Kurt Vonnegut you can Subscribe to Getting Real by Email using the form below. Please be sure to verify your email address when you receive the verification notice.
