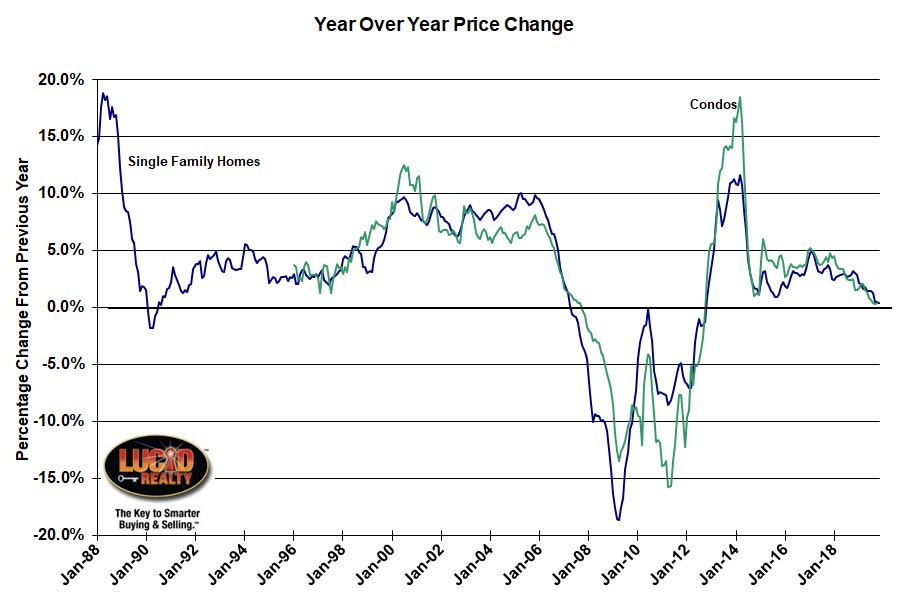
The November home price data released by S&P Dow Jones CoreLogic this morning actually showed a pickup in the nation’s year over year home price appreciation. Yet, the Case Shiller Chicago area home price data somehow managed to get worse.
For the nation as a whole single family home prices rose by 3.5% which was up from October’s 3.2% (revised downward from last month). The 20 metro area composite appreciated by 2.6%, an increase from October’s 2.2%. But then you look at the Chicago area and, first, they revised the October number down from 0.5% to 0.3% which would be the lowest rate of appreciation in almost 7 years. And, then, appreciation for the 12 months ending in November was only 0.4%. Aside from the fact that that number is so much lower than the averages it’s also now the lowest appreciation rate among all 20 metro areas, even below San Francisco which appreciated at 0.5%.
The graph below puts it all in historic perspective and you can see how our home price growth is screeching to a halt. It even looks like it might be in danger of going negative. The graph includes condo price appreciation, which was also only 0.4% in the 12 month period.
Craig J. Lazzara’s, Managing Director and Global Head of Index Investment Strategy at S&P Dow Jones Indices, comments make it sound like Chicago resides on a different planet:
With the month’s 3.5% increase in the national composite index, home prices are currently 59% above the trough reached in February 2012, and 15% above their pre-financial crisis peak. November’s results were broad-based, with gains in every city in our 20-city composite.
At a regional level, Phoenix retains the top spot for the sixth consecutive month, with a gain of 5.9% for November. Charlotte and Tampa rose by 5.2% and 5.0% respectively, leading the Southeast region. The Southeast has led all regions since January 2019.
As was the case last month, after a long period of decelerating price increases, the National, 10-city, and 20-city Composites all rose at a modestly faster rate in November than they had done in October. This increase was broad-based, reflecting data in 15 of 20 cities.
Case Shiller Chicago Area Home Price Index By Month
Chicago area single family home and condo prices both fell from October as is normal at this time of the year – single family homes by 0.6% and condos by 0.7%. The history of these monthly numbers going back to 1987 appears in the graph below.
Unlike most of the rest of the country we still have not reached our bubble peak values and don’t seem to be in any hurry to get there. Single family homes are still 14.6% below those highs and condos are 7.5% short. Sadly, that leaves single family home prices below where they were during the entire period from July 2004 – October 2008 and condo prices below their levels from May 2005 – November 2008.
Nevertheless, we’ve recovered quite a bit from the bottom with single family homes bouncing back 40.2% and condo prices bouncing back 53.0%. Then again, check out that red trendline in the graph below. I drew it based upon the Chicago area’s price history before the bubble. Not only do we currently trail it by 28.1% but you can tell that the gap is widening over time.
#CaseShiller #ChicagoHomePrices #HomePrices
Gary Lucido is the President of Lucid Realty, the Chicago area’s full service real estate brokerage that offers home buyer rebates and discount commissions. If you want to keep up to date on the Chicago real estate market or get an insider’s view of the seamy underbelly of the real estate industry you can Subscribe to Getting Real by Email using the form below. Please be sure to verify your email address when you receive the verification notice.

