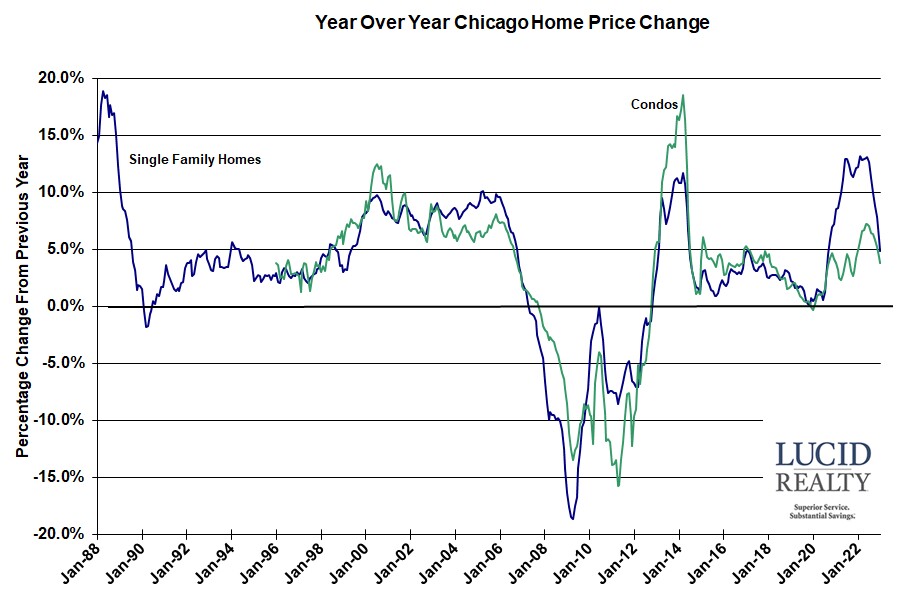
The folks at Dow Jones S&P Corelogic came out with their January Case Shiller home price indices for the country and 20 metro areas this morning. The year over year single family home price appreciation numbers are falling fast across the board but the Case Shiller Chicago area index shows our area doing less poorly than much of the country. The nation’s home prices are now only up 3.8% in the last year while the 10 and 20 metro area averages are up even less at 2.5%. However, the Chicago area is up 4.8%. This is reflected in the fact that Chicago is once again in 7th place (actually tied for 7th place with Cleveland) when ranked for appreciation among the 20 metro areas. Other than Chicago and New York the best performing metro areas tend to be in the southeast.
You can see just how fast the Chicago area year over year single family home price appreciation has dropped recently in the graph below. January’s number is the lowest it’s been in 28 months and condo prices are meeting a similar fate, hitting a 19 month low of 3.8%.

Craig J. Lazzara, Managing Director at S&P DJI, feels that “Mortgage financing and the prospect of economic weakness are … likely to remain a headwind for housing prices for at least the next several months”
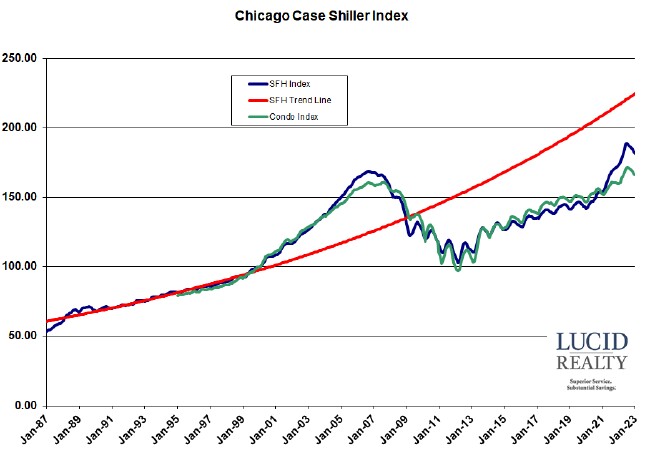
Case Shiller Chicago Area Home Price Index By Month
With a 5.1% drop in the nation’s single family home prices over the last 7 months it’s probably safe to say that the drop is not just normal seasonality. The graph below of the monthly Case Shiller Chicago area index reflects a 3.8% drop in home prices over the last 6 months, which could just maybe be normal seasonality? Compare it to previous seasonal dips. Condo prices have fallen only 3.1% in that same time period. However, the drop in Chicago area home prices did slow down a bit in January with single family home and condo prices both falling 0.5% vs. 1.2% and 1.1%, respectively, in December.
Single family home prices are still 7.7% above their housing bubble peak and 77.6% above the bottom of the housing crash. Meanwhile, condo prices are a mere 3.1% above their peak and 71.6% above their bottom. And if you compare home prices to that red trend line that I created based on pre-bubble prices you’ll see that we were on our way to closing that gap but now the gap is widening again. Single family home prices are now 18.5% off trend.

