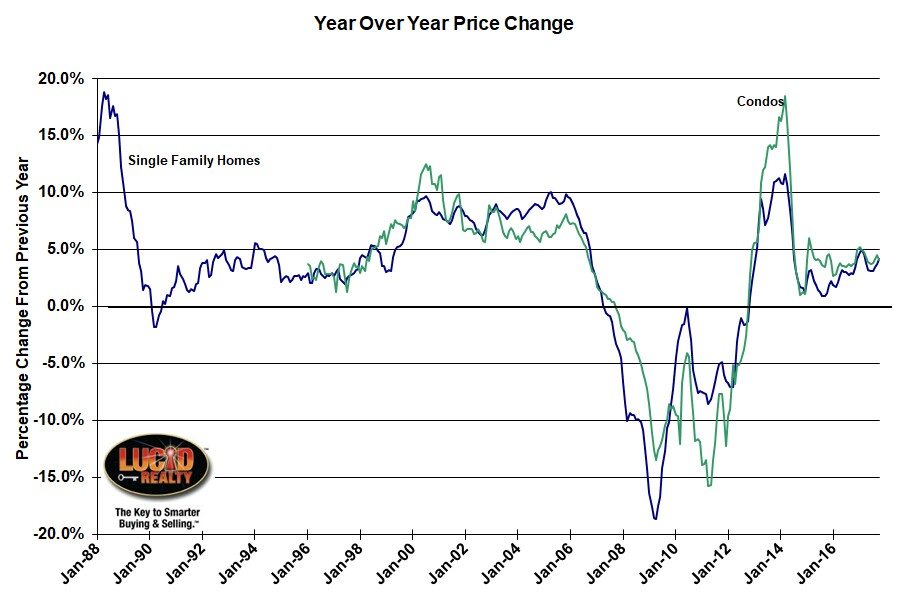
On Tuesday Dow Jones S&P CoreLogic released the October Case Shiller home price indices which showed that national home prices rose by 6.2% in the last year while the composite for the top 20 metro areas rose by 6.4%. While the Chicago area did realize it’s 60th consecutive month of annual home price gains and a 7 month high in annual price appreciation, the 4.1% year over year gain once gain placed Chicago in 2nd to last place among 20 metro areas. The only metro area showing lower home price appreciation was Washington, DC.
Condos in the Chicago area also gained 4.1% in the last 12 months, which was down a bit from last month’s 4.5% 12 month gain.
David M. Blitzer, Managing Director & Chairman of the Index Committee at S&P Dow Jones Indices, explained the main drivers of increasing home prices and looked forward to what might slow down home price appreciation:
Home prices continue their climb supported by low inventories and increasing sales. Nationally, home prices are up 6.2% in the 12 months to October, three times the rate of inflation. Sales of existing homes dropped 6.1% from March through September; they have since rebounded 8.4% in November. Inventories measured by months-supply of homes for sale dropped from the tight level of 4.2 months last summer to only 3.4 months in November.
Underlying the rising prices for both new and existing homes are low interest rates, low unemployment and continuing economic growth. Some of these favorable factors may shift in 2018. The Fed is widely expected to raise the Fed funds rate three more times to reach 2% by the end of the New Year. Since home prices are rising faster than wages, salaries, and inflation, some areas could see potential home buyers compelled to look at renting. Data published by the Urban Institute suggests that in some West coast cities with rapidly rising home prices, renting is more attractive than buying.
Case Shiller Chicago Area Home Price Index By Month
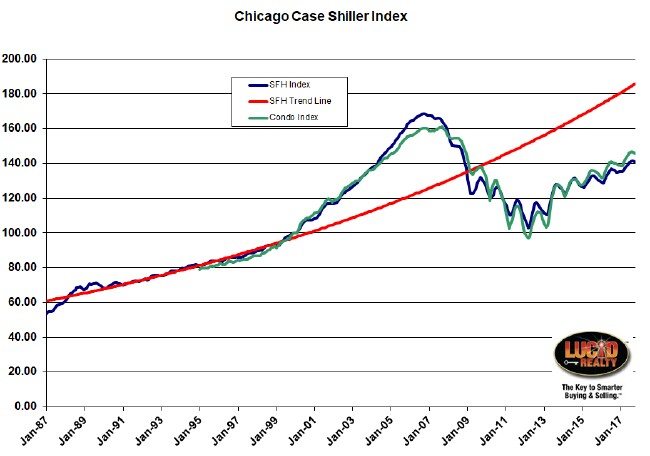
The graph below looks at the complete history of the Chicago area Case Shiller home price indices for single family homes and condos/ townhomes. The October single family home index was down 0.5% from September while the condo index was down 0.4%. A decrease is typical at this time of the year.
From the housing bubble peak in September 2006 single family home prices have declined a total of 16.7% and condo prices have declined 9.5% from their peak a year later. However, they have both recovered substantially from the bottom with single family home prices up 36.7% and condo prices up 49.8%.
But when you put today’s home price levels in historic perspective you see that single family home prices are still lower than they were from May 2004 all the way through November 2008 and condo prices are still lower than the period from February 2005 through December 2008.
The graph below also includes a red trend line established from the index values prior to the housing bubble and that line would have exceeded the housing bubble peak by now. As you can see we are well below that trend line today – by 24.4% to be exact.
#ChicagoHomePrices #CaseShiller
Gary Lucido is the President of Lucid Realty, the Chicago area’s full service discount real estate brokerage. If you want to keep up to date on the Chicago real estate market, get an insider’s view of the seamy underbelly of the real estate industry, or you just think he’s the next Kurt Vonnegut you can Subscribe to Getting Real by Email using the form below. Please be sure to verify your email address when you receive the verification notice.

