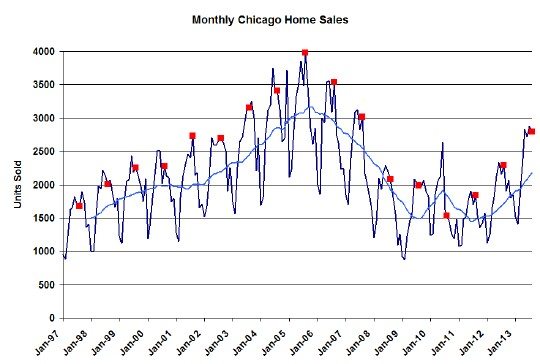
August marked the 26th month in a row of spectacular real estate market performance in Chicago with home sales up 26.4% over last year and at the highest level of the last 6 years. In fact, as you can see in the graph below August 2013 home sales were the 6th highest in the last 17 years that I have data for – somewhere between the level of 2002 and 2003, which was well into the bubble years.
We’re still a week and a half away from the Illinois Association of Realtors releasing their numbers, which should be close to mine except that they are going to tell you that sales were only up 21.9% because of a peculiarity in the way they comp the data. The other statistic they will brag about will be the 22.5% increase in Chicago median home prices, which mostly reflects the greater mix of higher priced homes sold in the face of declining distressed properties. Yeah, higher prices also factor into the higher median price but it’s not the primary factor as some real estate journalists seem to think.
Chicago Home Contract Activity
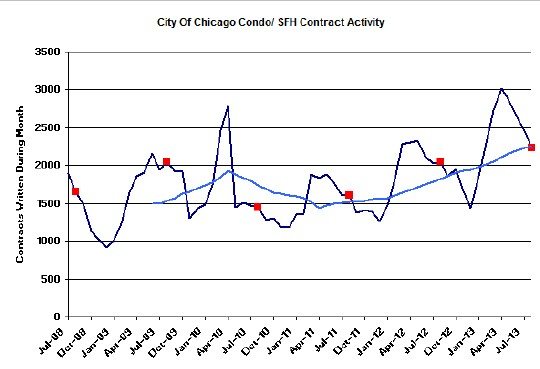
The only fly in the ointment is that August home contract activity, while still above last year, was only 9% higher, which is the lowest increase in 20 months. Look…at some point you’re comping to very high numbers and it’s hard to beat them. You would expect the growth rate to slow down. But nevertheless it was the highest August in 6 years as you can see in the graph below.
The telltale sign that the growth in contract activity is slowing down is that pending home sales have dropped below last year at this time. In other words, the growth in closings occurred by drawing down the backlog of homes under contract. At the end of August there were 5478 homes waiting to close, which is only a 2 month supply and the lowest months of supply in the 16 months that I have been tracking this.
Distressed Home Sales
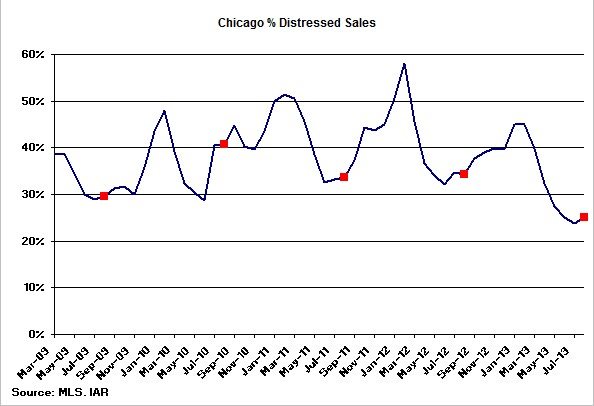
The percentage of distressed home sales still came in with the lowest August numbers in the last 5 years but it did tick up slightly from July. However, as you can tell from the graph below that is totally normal at this time of year.
Chicago Home Inventory
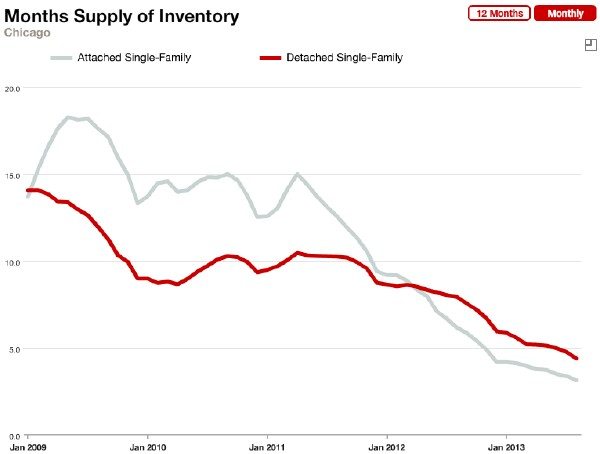
The inventory of homes for sale is still extraordinarily low. It’s puttering along at 3.1 months of condos and 4.4 months of single family homes. Now it turns out that those numbers are exactly the same one I reported last month for July, yet the graph below shows a steady decline. So what gives? It has to do with the fact that the numbers for the latest month drift up over the subsequent 2 – 3 months as contracts fall apart. I think over the next few months we are going to see this graph has bottomed out. It’s really hard to go below a 3 month supply. Eventually prices rise enough to attenuate demand.
Chicago Home Sale Market Times
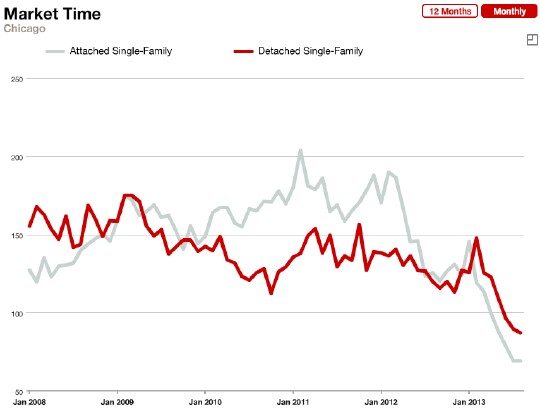
In the current real estate market environment we should not be surprised how quickly homes are selling. Demand is high and inventories are low so buyers have become trained to snap new properties up in record time over the last 6 years. Condos that sell are selling in 69 days while single family homes are selling in 87 days and it has nothing to do with the skills of any well known realtors, although unresponsive realtors can certainly slow down the sale of a home. So don’t let some smooth talking realtor convince you otherwise.
If you want to keep up to date on the Chicago real estate market, get an insider’s view of the seamy underbelly of the real estate industry, or you just think I’m the next Kurt Vonnegut you can Subscribe to Getting Real by Email. Please be sure to verify your email address when you receive the verification notice.
