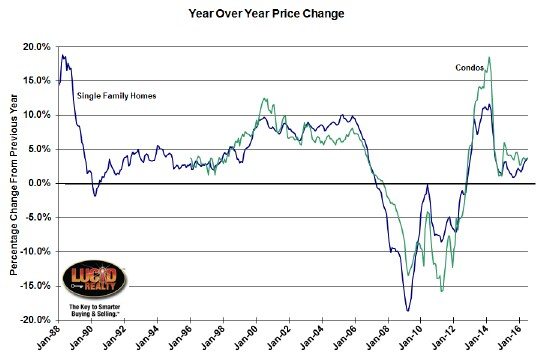
This morning’s release of of the July S&P CoreLogic Case Shiller home price index for the nation and 20 metro areas is a classic good news/ bad news story. I’ll give you the good news first: The Case Shiller Chicago home price index was up 3.7% from a year ago, which is the strongest year over year increase in home prices in 2 years as reflected in the blue line in the graph below. As I like to point out that’s higher than the after tax cost of many people’s mortgages so it’s basically covering their mortgages.
Furthermore, this makes 45 months in a row of year over year price gains. The bad news is that the Chicago area is still in 4th from last place in terms of the annual home price gains of 20 metro areas tracked by Case Shiller.
The year over year gain in Chicago area condo prices, which are plotted in the green line below, were also up 3.7% over last year. It’s done better than that in the not too distant past so I’m not excited about it.
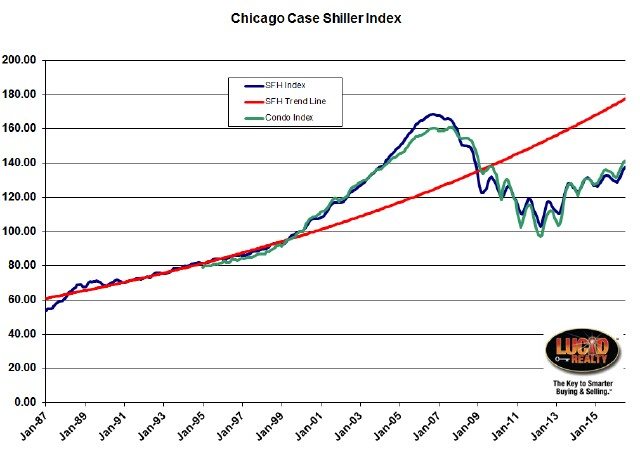
 Case Shiller Chicago Home Price Index By Month
The graph below shows the monthly values of the Chicago area single family home and condo price indices going back to 1987 along with a trend line that is based upon the pre-bubble years.
From June single family home prices were up 0.9% while condo prices were up 0.4%. However, what is concerning is that when you take seasonality out prices were actually down by 0.5% and 0.9% respectively.
While single family home prices have recovered 34.0% from the bottom they are still off 18.4% from the bubble peak. Keep that in mind as you read the commentary below the graph. Condo prices have recovered 45.2% from the bottom but even they are still 12.3% from the top.
In fact, single family home prices are still below their level during the entire period from January 2004 through December 2008 while condo prices are below their level from July 2004 through January 2009. Also, single family home prices are still lagging that trendline by 22.4%. So the concept of “recovery” is relative.

Both the housing sector and the economy continue to expand with home prices continuing to rise at about a 5% annual rate. The statement issued last week by the Fed after its policy meeting confirms the central bank’s view that the economy will see further gains. Most analysts now expect the Fed to raise interest rates in December. After such Fed action, mortgage rates would still be at historically low levels and would not be a major negative for house prices.
The S&P CoreLogic Case-Shiller National Index is within 0.6% of the record high set in July 2006. Seven of the 20 cities have already set new record highs. The 10-year, 20-year, and National indices have been rising at about 5% per year over the last 24 months. Eight of the cities are seeing prices up 6% or more in the last year. Given that the overall inflation is a bit below 2%, the pace is probably not sustainable over the long term. The run-up to the financial crisis was marked with both rising home prices and rapid growth in mortgage debt. Currently, outstanding mortgage debt on one-to-four family homes is 12.6% below the peak seen in the first quarter of 2008 and up less than 2% in the last four quarters. There is no reason to fear that another massive collapse is around the corner.
#ChicagoHomePrices #CaseShiller
Gary Lucido is the President of Lucid Realty, the Chicago area’s full service discount real estate brokerage. If you want to keep up to date on the Chicago real estate market, get an insider’s view of the seamy underbelly of the real estate industry, or you just think he’s the next Kurt Vonnegut you can Subscribe to Getting Real by Email using the form below. Please be sure to verify your email address when you receive the verification notice.
