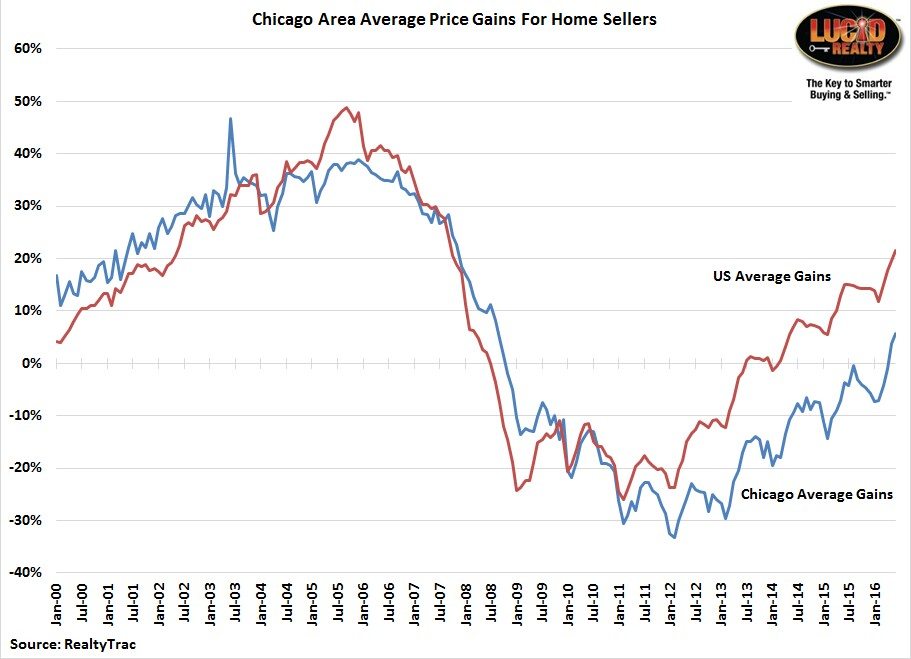
As I like to remind you there is entirely too much talk about how high home prices are and how the housing market is in another bubble. Based upon all the talk you would think that the average Chicago area home seller is raking in huge profits on the sale of their home but it’s just not true. It turns out that all the buzz is just gross generalizations and a few months ago I discovered that RealtyTrac collects the data (actually these guys collect a ton of interesting data) that demonstrates just how badly the Chicago area real estate market is lagging the rest of the country.
The data I’m talking about is part of RealtyTrac’s quarterly U.S. Home Sales Report that shows, among other things, how much home sellers have recently gained on the sale of their homes. RealtyTrac calculates the gain on the most recent sale by comparing that sale to the previous sale on record and then they average the gains across all the homes sold in their database. Admittedly, every home in the group is held for a different length of time and you would expect that the holding period would influence the gain realized by the home seller. However, you would also expect that with a large enough sample the mix of holding periods would be roughly the same from one month to the next.
I was able to obtain the historical data for Chicago and the nation as a whole and graph it below. What’s interesting is that the average home seller in the country started profiting from the sale of their homes once again in July 2013 but home sellers in the Chicago area continued to lose money until May of this year when they finally showed an average profit of 4%, with June following with a 6% average gain. Those were the first times that the averages showed a profit in roughly 7 1/2 years. Meanwhile, the average home seller in the country gained 22% in June. Let’s hope that Chicago is simply lagging the rest of the country and will eventually catch up!
Oh…and as a side note June home sellers in the San Francisco area made a 72% profit! That was the highest in the nation.

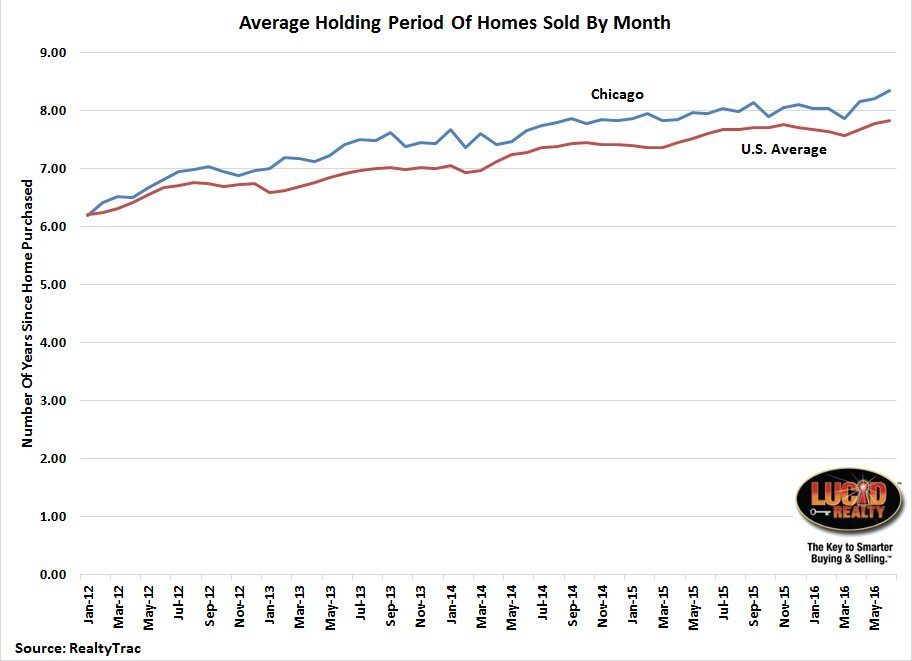
As part of their analysis RealtyTrac also tracks the average holding period of the sales that occur in each month and that is also enlightening. I graphed the data below and you can see that, back in January 2012, both Chicago and the country as a whole were selling homes that had been held an average of about 6.2 years. In June that holding period had climbed to 8.3 years for Chicago but only 7.8 years for the country as a whole. So people are staying in their homes a bit longer now but more so in Chicago than the rest of the country. And, by the way, an 8.3 year holding period implies that housing turnover is about 12% per year.
Also, that means that the homes that sold in Chicago during June had been purchased back in February/ March 2008 – kinda, sorta on average. Well, guess what? The Case Shiller home price index is still down about 10% from then. So it’s actually surprising that home sellers are doing as well as they are.
There was one other interesting tidbit in this Home Sales Report. RealtyTrac also reports on the share of cash sales at the national level each month and June hit the lowest level since the 4th quarter of 2007 at 27.5%. The historic pattern suggests that lower prices brought out the cash buyers – possibly investors – in droves and now that prices are rising they’re backing off.
#RealEstate #ChicagoRealEstate #ChicagoHomePrices
Gary Lucido is the President of Lucid Realty, the Chicago area’s full service discount real estate brokerage. If you want to keep up to date on the Chicago real estate market, get an insider’s view of the seamy underbelly of the real estate industry, or you just think he’s the next Kurt Vonnegut you can Subscribe to Getting Real by Email using the form below. Please be sure to verify your email address when you receive the verification notice.

