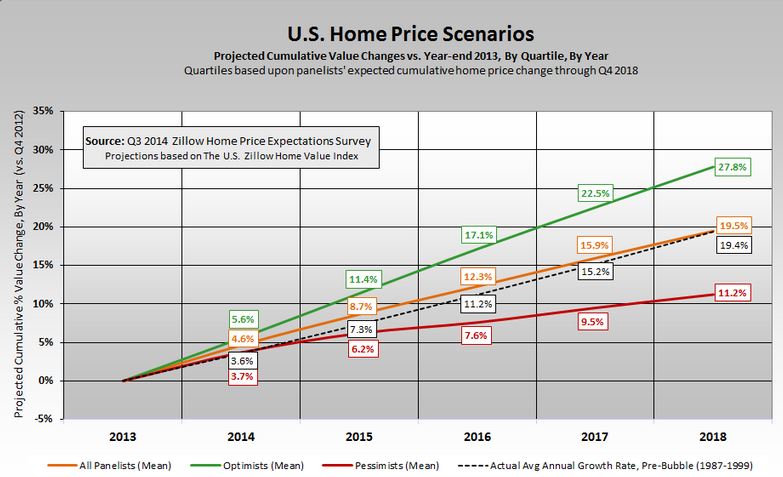
As I mentioned last week the most recent release of the Case Shiller home price index for the nation showed considerable slowing in the rate of home price increases. You would think that this would temper the enthusiasm of the experts as they provide their own home price forecasts but I guess not. Zillow/ Pulsenomics released their second quarter home price expectations survey of 104 real estate experts and their national outlook basically remains unchanged from the May home price expectations survey – yeah this release seems a bit earlier than usual.
The graph below (you can click on it for a larger version) shows the cumulative home price forecast by year. The orange line is the consensus forecast and the black line is the pre-bubble growth rate extrapolated for the next several years. Basically the experts are forecasting a return to normal price appreciation and it works out to essentially 3.6% per year on average.
In the release the experts noted that the Millennials are delaying home ownership but it seems to me that this has already been reflected in the data and the forecasts and the forecast still remains fairly optimistic. In addition they are also forecasting a negative impact from 30 year fixed mortgage rates of 5.28% by July 2016 but again this can not be something new and, as I’ve pointed out in the past, people bought plenty of homes in the past when mortgage rates were much higher than this.
Outlook For Chicago Area Home Prices
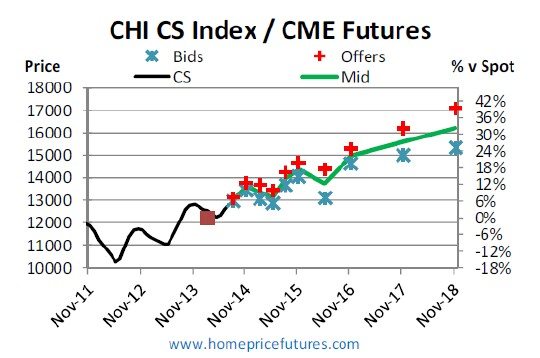
Pulsenomics/ Zillow doesn’t provide a home price forecast for the Chicago market but a possibly even better indicator is the Case Shiller futures prices. I got the graph below from John Dolan who prepares a monthly recap of the market activity. Here is his July Case Shiller review. As John points out the market is very thinly traded so you have to be careful interpreting the data. Nevertheless, it is an indication of the future direction of prices. Heck, if you don’t agree with it you are free to step in and trade against it.
The outlook in July is a bit more optimistic than it was in April when I last presented this data as it is now above an index value of 160 for November 2018 – 162.1 to be exact, compared to 159.5. That works out to an average compounded rate of appreciation of 4.8% over the 5 year period from September 2013 to September 2018. If that happens it will be great.
On Thursday I’ll be posting my July Chicago real estate market update. Here is a teaser: sales are down again.
#homepriceforecast
If you want to keep up to date on the Chicago real estate market, get an insider’s view of the seamy underbelly of the real estate industry, or you just think I’m the next Kurt Vonnegut you can Subscribe to Getting Real by Email. Please be sure to verify your email address when you receive the verification notice.

