The Q3 2022 U.S. Foreclosure Market Report from ATTOM came out last week showing that the nation’s foreclosure activity has still not returned to pre-pandemic levels while the story for Chicago is a bit different. Foreclosure starts across the nation have risen considerably since the moratorium expired but they still fall a bit shy of where we were in the first quarter of 2020.
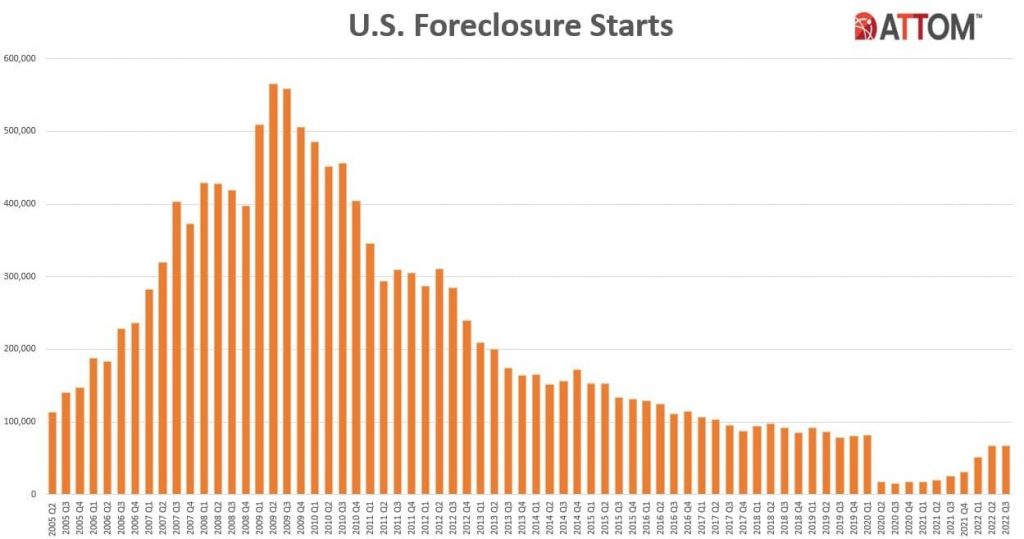
Rick Sharga, executive vice president of market intelligence for ATTOM, believes that “Foreclosure activity is reflecting other aspects of the economy, as unemployment rates continue to be historically low, and mortgage delinquency rates are lower than they were before the COVID-19 outbreak.”
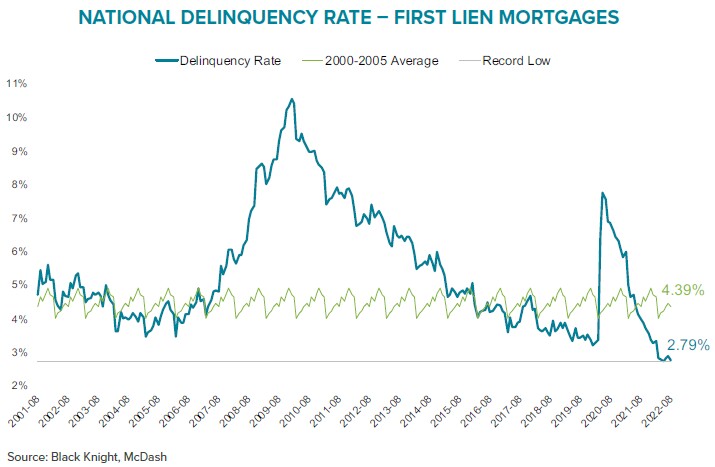
To that point, let’s take a closer look at mortgage delinquencies for a minute, courtesy of Black Knight’s August Mortgage Monitor Report. The graph below really highlights just how historically low the national delinquency rate is. That strongly suggests that we’re not going to see a lot of foreclosure starts in the foreseeable future.
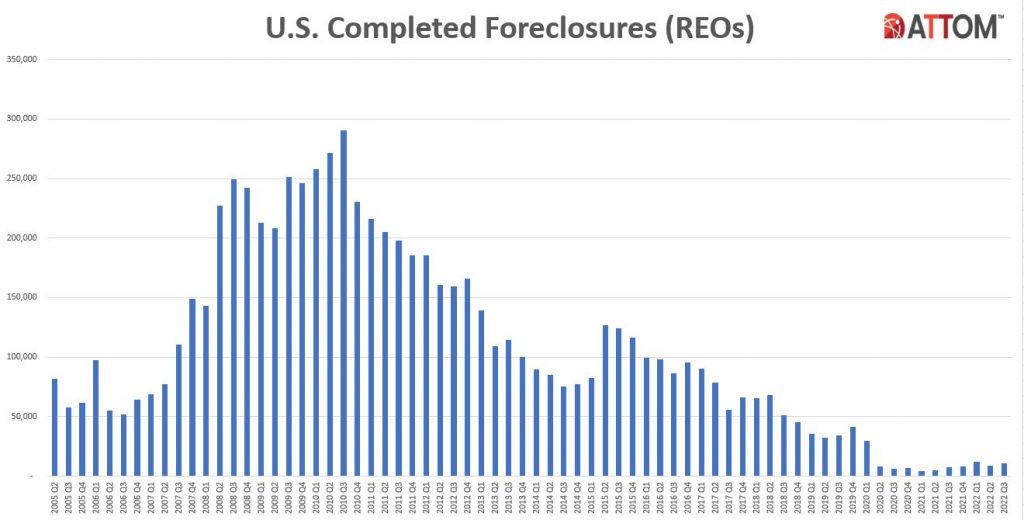
Even more dramatic is the fact that completed foreclosures have not returned anywhere near to their pre-pandemic level. Rick Sharga appropriately explains this in terms of the benefits accruing to homeowners from higher real estate values:
Very few of the properties entering the foreclosure process have reverted to the lender at the end of the foreclosure. In fact, nearly three times more homes were repossessed by lenders in the second quarter of 2019 than in the second quarter of 2022. We believe that this may be an indication that borrowers are leveraging their equity and selling their homes rather than risking the loss of their equity in a foreclosure auction.
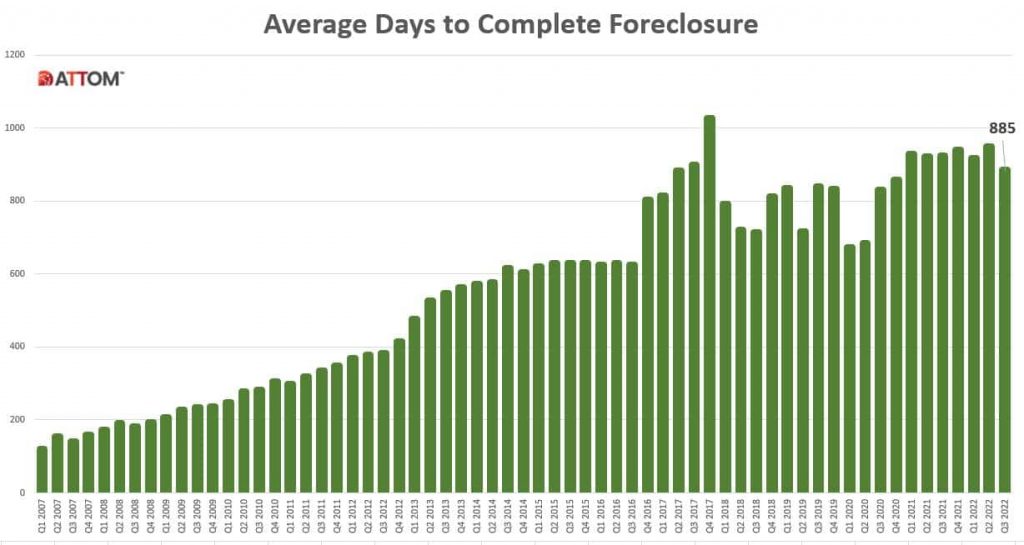
The Q3 report goes on to show the average time required to complete a foreclosure, which is always amusing because it’s so ridiculously long. It did decline slightly but it remains at the upper end of the historic range. Note that this figure varies widely from one state to the next due to differing laws – from a low of 113 days in Minnesota to a high of 2121 days in Hawaii.
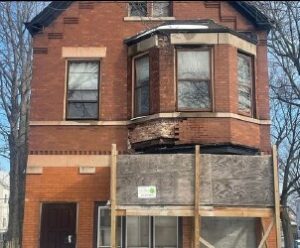
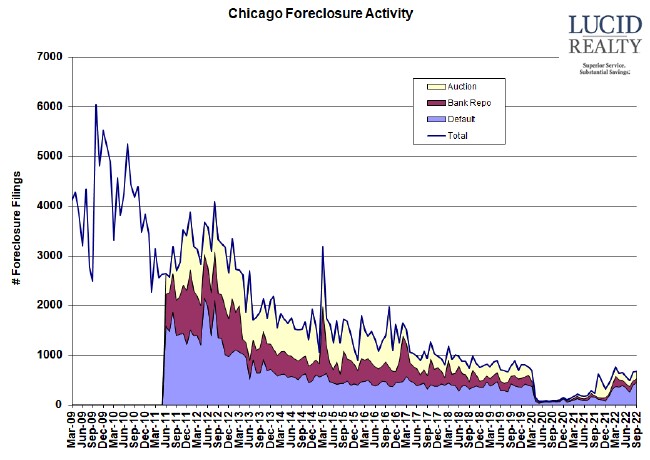
As I mentioned at the top of this post the Chicago foreclosure activity story appears to be a bit different than the rest of the nation. In the graph below you can see that defaults are actually a bit higher than they were when the pandemic started. What’s that all about? But the other two components of foreclosure activity are a bit lower. The net result though is a level of foreclosure activity on par with where we were pre-pandemic.
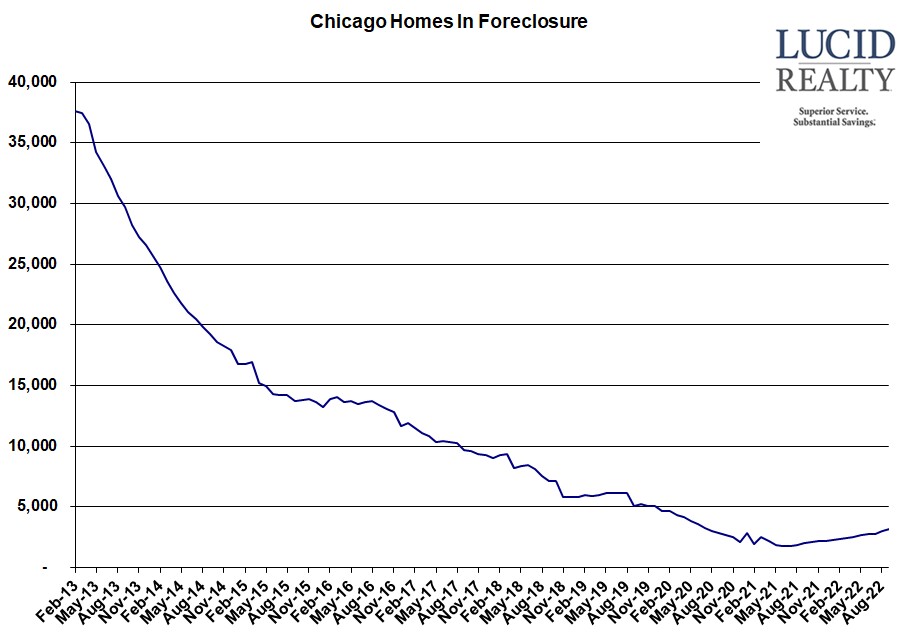
Chicago Shadow Inventory
The number of homes in Chicago that are in some stage of foreclosure had been drifting down for years. That trend continued during the pandemic, aided by the foreclosure moratorium. However, with the moratorium over there is a slight upward drift off the lows – adding 1357 units since the bottom. However, that only takes us back to the level last seen in July 2020 and I wouldn’t expect it to go much higher to Rick’s point above. With home prices so much higher over the last few years foreclosure looks like a pretty awful alternative compared to just selling a home to pay off the mortgage.
