My annual review of Chicago’s new construction is one of my favorite posts of the year because it really helps me and others get a read on which neighborhoods are on the move and how fast it’s happening. Want to know where gentrification is happening? Just look for the new single family homes being built around the city. If you see a cluster of $800K homes then you know gentrification is well underway in that neighborhood. A cluster of $600 – 700K homes would be in a neighborhood at an earlier stage and a neighborhood with new homes around $500K would be at the very beginning stages.
This year my list – new homes currently on the market or sold in the last 12 months – is down to only 572 from 632 last year. The fact that only 8.7% of the new homes built were listed below $400 K speaks to the high housing costs in Chicago, despite the fact that Chicago is the most affordable global city on the planet. Only 18.2% were below $500 K. So Chicago really is a city for the rich and becoming even more so as evidenced by the fact that 33% of these homes were above $1 MM. 6.6% were above $2 MM.
I mapped all of these homes below so that at glance you can see where the action is.
Chicago’s Single Family Home New Construction Mapped
Each home is represented by a balloon, color coded according to price. Clicking on a balloon reveals some basic information on the home such as address, list price, sale price (if it sold), size, and community area. You can also click on the colored community areas to identify them and clicking on the icon in the upper left corner will display the price legend. You can also share the map, pan it, zoom it or expand it for a better view.
The pattern of what is being built and where has been pretty consistent now for a few years. All the activity is west of Clark and prices go down as you go north, south, or west. And, for the most part, development seems to occur in clusters. Nobody wants to be the only new home in an area. And $1.5 MM homes are being built west of Western.
Chicago New Single Family Home Construction Activity By Neighborhood
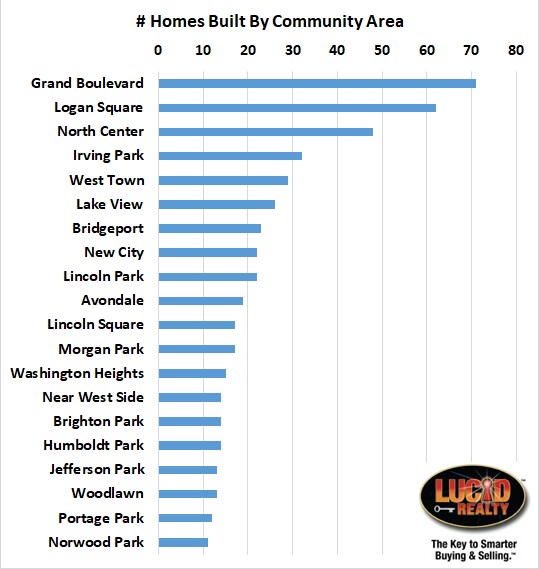
I also aggregated the number of homes by community area and graphed the top 20 below. The ranking of these areas is very close to what we saw last year. However, Grand Boulevard (contains much of Bronzeville) has even more going on this year than last. On the other hand, once you get past Logan Square you start to see some sizeable dropoffs in activity from last year. Jefferson Park and Portage Park appear to be new additions to the top 20 list this year.
Average New Single Family Home Prices By Neighborhood
Looking at the average list prices of these new homes tells us a lot about the community areas they are in. So I took my top 20 list from above and calculated those averages and graphed them below – high to low. It’s no surprise that the homes being built in Lincoln Park, Near North Side, and Lake View are at the top of the list. Generally speaking, the average price of the homes being built in all neighborhoods are up slightly over last year. Once again the top 6 community areas all average above $1 MM.
This year the bottom 4 community areas all averaged less than $500 K, compared to only 3 last year. Humboldt Park jumped higher on the list this year with an average above $700 K! Grand Boulevard is still averaging just over $600 K.
#ChicagoNewConstruction #ChicagoRealEstate #NewConstruction #ChicagoNewHomes
Gary Lucido is the President of Lucid Realty, the Chicago area’s full service real estate brokerage that offers home buyer rebates and discount commissions. If you want to keep up to date on the Chicago real estate market or get an insider’s view of the seamy underbelly of the real estate industry you can Subscribe to Getting Real by Email using the form below. Please be sure to verify your email address when you receive the verification notice.


