Despite the fact that home inventories in Chicago were already falling to record low levels in the early part of the year homes that closed in the first quarter showed continued declines in prices. This according to today’s release of the Case Shiller home price index for the month of March, which actually includes data from January – March. Chicago was one of only 5 (out of 20) cities where prices continued to decline. It’s a little surprising to say the least as there were already early instances of multiple bids for desirable homes in the first quarter.
The Chicago index for single family homes declined by an additional 2.5% in March, while condo prices declined an additional 0.3%. These price drops bring single family home prices down to levels last seen in April 2000 and condo prices back to September/ October 1999 levels, despite the fact that there has been at least some inflation in that time period. Since the housing bubble peaked single family home prices have declined a total of 39%, with condo prices declining a total of 39.5%. You can see the long term trend in the graph below.
The red line in the graph represents the long term trend line for single family home prices, based upon the pre-bubble period. Based upon that line single family home prices are running more than 32% below the trend line.
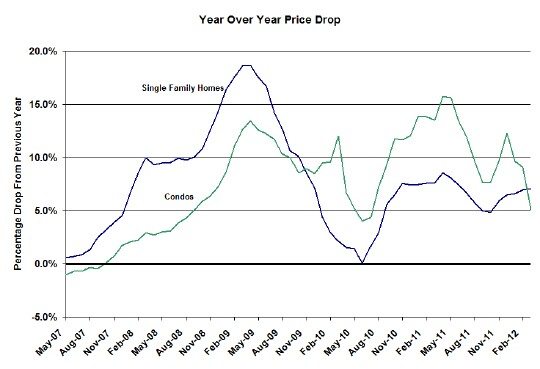
Also, on a year over year basis the price declines are not letting up as you can see in the graph below. Single family home prices are down 7.1% in the last year while condo prices are down 5.1% and it doesn’t even show signs of improvement in the rate of decline.
According to David M. Blitzer, Chairman of the Index Committee at S&P Indices:
There are some better numbers: Only three cities – Atlanta, Chicago and Detroit – saw annual rates of change worsen in March. The other 17 cities and both composites saw improvement in this statistic, even though most are still showing a negative trend. Moreover, there are now seven cities – Charlotte, Dallas, Denver, Detroit, Miami, Minneapolis and Phoenix – where the annual rates of change are positive. This is what we need for a sustained recovery; monthly increases coupled with improving annual rates of change. Once we see this on a broader level we will be able to say the market has turned around.

