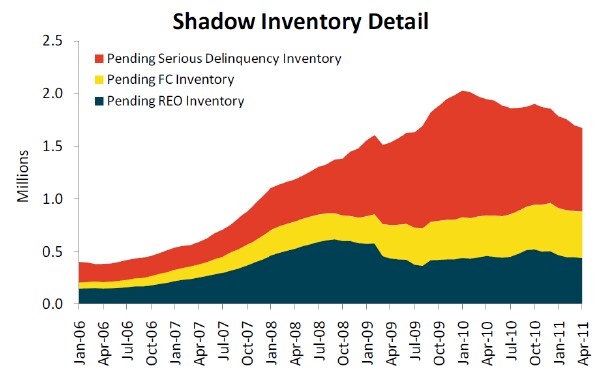
CoreLogic released their shadow inventory numbers for April yesterday and it shows a decline in the absolute number of homes that are not yet on the MLS but are distressed – 90 days or more delinquent, in foreclosure, or already owned by banks. The numbers declined from 1.9 MM units a year ago to 1.7 MM this year but note that these are national numbers. You can see their graph below.
The CoreLogic report says that “The decline was due to fewer new delinquencies and the high level of distressed sales, which helped reduce the number of outstanding distressed loans.”
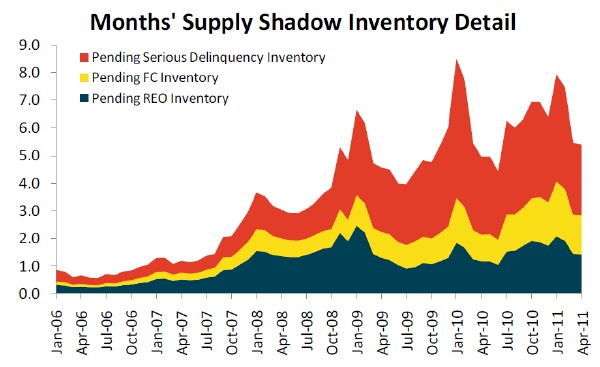
However, when you look at the data on a month’s of supply basis (how long it will take to sell all these distressed homes) you get a very different picture. While the graph above shows a plateauing of the numbers in absolute terms the graph below shows a clear upward trend, which I assume is the result of a housing market that has really sucked up until now. The April month’s of supply was basically flat with last year at 5 months.
5 months doesn’t sound like a lot but Mark Fleming, chief economist for CoreLogic, does’nt sound too optimistic: “it will probably take several years for the shadow inventory to be absorbed given the long timelines in processing and completing foreclosures.”
Better read that last sentence again because this is where the rubber hits the road. You can check out the S&P shadow inventory report which focuses on the “months to clear” the inventory and also provides the data by metropolitan area. The tables area a bit confusing because they are labeled months of inventory but they must be really focusing on what Mark Fleming is talking about since the numbers are much higher than what CoreLogic shows.
So what does S&P say about Chicago? For the first quarter they show Chicago at 65 months, up from 46 months for the first quarter of last year. Hmmm. Not pretty.

