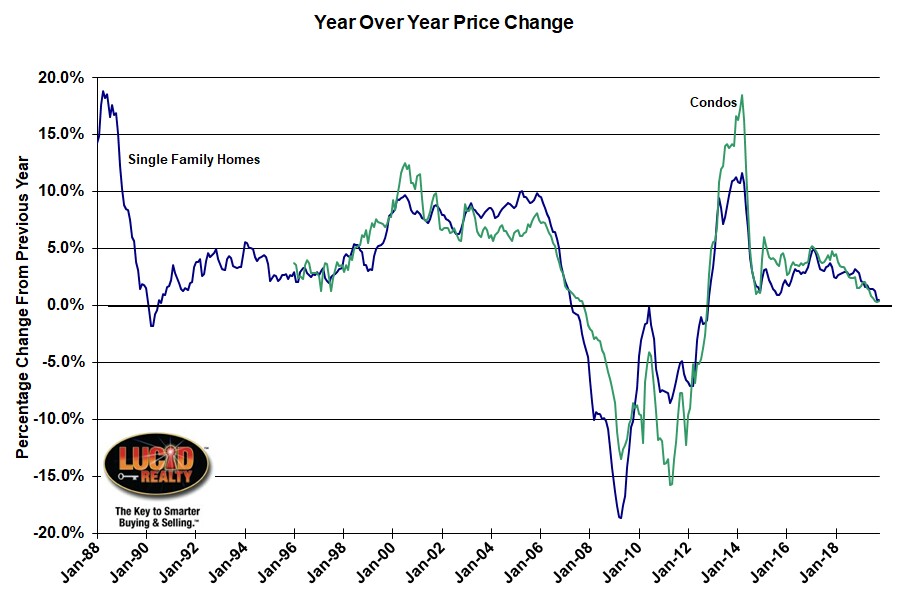
It looks like we get to end 2019 with another relatively sad note for the Chicago area real estate market. S&P Dow Jones CoreLogic released their October home price data this morning and the Case Shiller Chicago index was pretty pathetic, which really wasn’t much of a surprise given how the data has been trending. To see what I mean check out the graph below which shows the historic year over year home price changes in the area. The gains have been getting smaller and smaller with the last 2 months registering only 0.5% for single family homes and 0.4% for condos, the lowest annual appreciation rates in about 7 years.
When compared to appreciation in the other 19 metro areas tracked by the Case Shiller index that places Chicago area single family homes 2nd from the bottom of the list, behind only the San Francisco metro area. Meanwhile, the nation as a whole appreciated by 3.3% in the 12 months ending in October, which was marginally higher than the 3.2% gain for September. The 20 city composite showed a 2.2% gain. So, yeah, 0.5% is pretty bad and begs the question of whether or not actual price declines might not be too far behind.
I didn’t find Craig J. Lazzara’s (Managing Director and Global Head of Index Investment Strategy at S&P Dow Jones Indices) comments particularly insightful but I’ll share some of them with you for the value of the data included:
With October’s 3.3% increase in the national composite index, home prices are currently more than 15% above the pre-financial crisis peak reached July 2006. October’s results were broad-based, as both our 10- and 20-city composites rose. Of the 20 cities in the composite, only San Francisco saw a year-over-year price decline in October.
At a regional level, Phoenix retains the top spot for the fifth consecutive month with October’s 5.8% year-over-year gain. The Southeast region was also strong, as Tampa, Charlotte, and Atlanta all rose by more than 4.0%.
Case Shiller Chicago Area Home Price Index By Month
The graph below shows the monthly values for the Case Shiller Chicago index going back to January 1987 so that you can see what the actual price trend has been. The October single family index fell 0.4% from September while the condo index fell 0.3%, which is kinda normal at this time of year.
In keeping with our underdog status, we have not exceeded the peak valuations from the bubble like the rest of the country. Instead, our single family homes are still 13.9% below the peak with condo prices falling 6.9% short. Another way of looking at how much ground we still have to cover is to note that single family home prices were higher than they are now during the entire period from August 2004 – October 2008 and condo prices were higher from July 2005 – October 2008.
What’s even more depressing is that we are trailing that red trendline in the graph below by 27.3% and the gap appears to be widending. That trendline represents the pre-bubble home price appreciation in the Chicago area so it’s not like it’s unachievable.
So it’s like we haven’t fully recovered from the bursting of the housing bubble, despite the fact that single family home prices have bounced back 41.2% from the bottom and condo prices have come back 54.1%.
#CaseShiller #ChicagoHomePrices #HomePrices
Gary Lucido is the President of Lucid Realty, the Chicago area’s full service real estate brokerage that offers home buyer rebates and discount commissions. If you want to keep up to date on the Chicago real estate market or get an insider’s view of the seamy underbelly of the real estate industry you can Subscribe to Getting Real by Email using the form below. Please be sure to verify your email address when you receive the verification notice.

