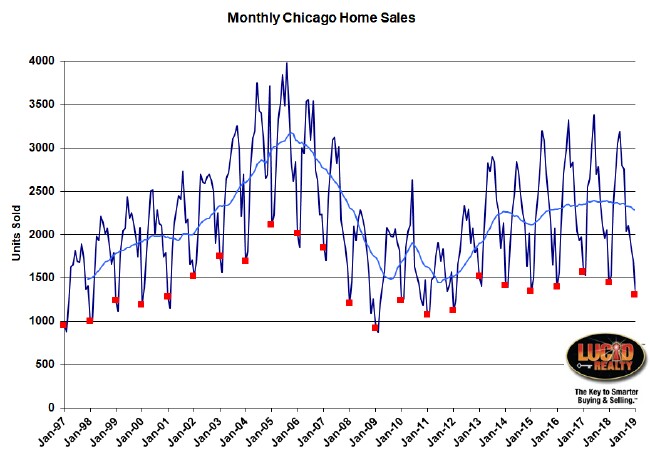
It looks like January was another weak month for home sales in the Chicago real estate market – down 7.1% from last year. Check out the graph below for the historical perspective. All Januaries are flagged with red markers and the light blue line is a 12 month moving average.
January came in lower than all but one of the previous 6 years and it marked the 6th time in 8 months that sales were lower than the previous year. It’s therefore no surprise that the moving average has been on the decline now for several months. Read further for an explanation as to why sales are so low.
The Illinois Association of Realtors will be reporting on this in a couple of weeks but they will show a 9.1% decline because of the flawed methodology they employ.
Chicago Home Contract Activity
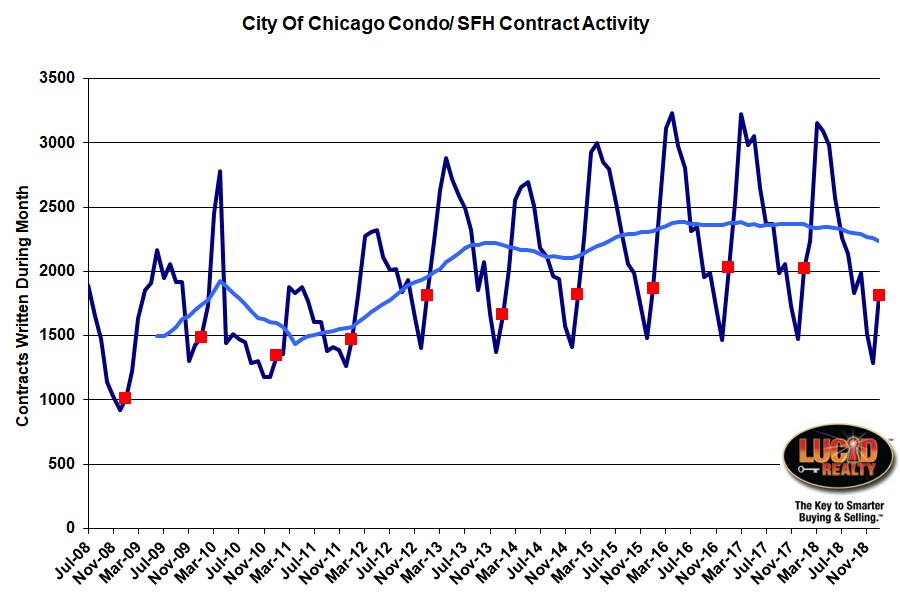
Home contract activity, which leads closings by 1 – 2 months, was also down in January, to the lowest level in 5 years. The 10.6% decline from last year was the third month in a row with a double digit decline. In fact, 12 of the last 13 months have registered a decline from the previous year so it’s no wonder that the moving average is trending down and that closings are falling as well.
This decline in contract activity means that February closings will probably also be off from the previous year.
Pending Home Sales
The other piece of the puzzle that is a precursor to a weak February is pending home sales, which you can see trending down in the graph below. In fact, January hit the lowest level in 7 years, down by 350 units from last year.
Pending home sales basically represents the difference between contracts written and closings so a decline in this number means that some of January’s closings came from a draw down in this backlog. Therefore, there is a smaller backlog to feed February closings.
Distressed Home Sales
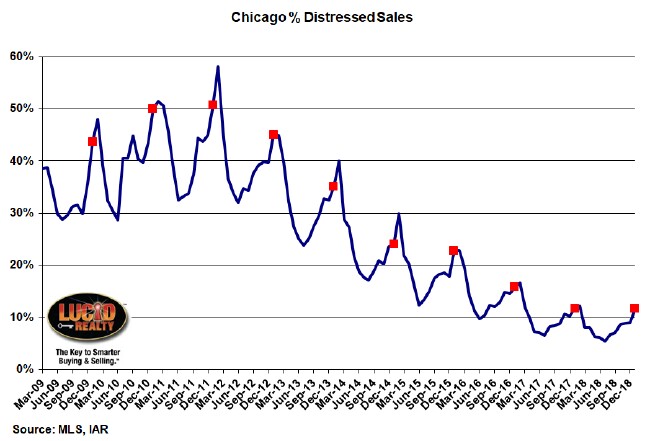
After 6 years of steady declines in the percentage of home sales that are distressed it looks like we have really bottomed out. The January percentage barely eked out a decline from last year, dropping only 0.1% to 11.7%. Realistically, you can only go so low with this number.
Chicago Home Inventory
I maintain that the inventory of homes for sale in Chicago remains the primary driver of lower home sales. Both detached and attached (condos/ townhomes) homes are at extremely low levels – only a 3.1 month supply. What’s unusual about this is that for many years detached inventory has been higher but now they are at the same level. While detached inventory fell from a 3.8 month supply last January attached inventory rose from a 2.7 month supply.
Nevertheless, these are both low levels of supply and it’s not hard to imagine that this is why home sales are so low.
Chicago Home Sale Market Times
The length of time it takes for homes to sell in Chicago is still pretty healthy, which is why I don’t think we have a demand problem. However, market times have drifted up a bit recently. In January, detached homes that did sell did so in 102 days, which is up only slightly from 99 days last year. Attached homes sold in 98 days, which is up a bit more from 86 days last year.
The increase in market time for attached homes is consistent with the slight rise in inventory noted above. So perhaps there is a bit of weakening demand for condos and townhomes.
If you go to our Web site you can find some additional real estate market data for Chicago that we maintain that you may find interesting.
#ChicagoRealEstate #RealEstate
Gary Lucido is the President of Lucid Realty, the Chicago area’s full service real estate brokerage that offers home buyer rebates and discount commissions. If you want to keep up to date on the Chicago real estate market, get an insider’s view of the seamy underbelly of the real estate industry, or you just think he’s the next Kurt Vonnegut you can Subscribe to Getting Real by Email using the form below. Please be sure to verify your email address when you receive the verification notice.


