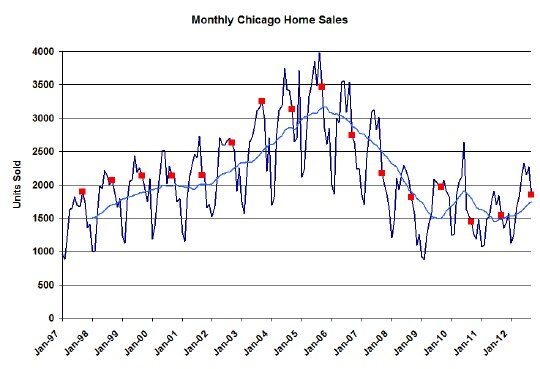
People who read this blog don’t have to wait until the Illinois Association of Realtors’ September sales release on October 19 to find out what I’m going to tell you right now. Chicago home sales for September were up 23.2% over last year, which is the 7th straight month of double digit year over year sales increases. Overall sales have been increasing for 15 straight months.
September Home Sales In Chicago
The graph below goes back to 1997 and all the September data points are flagged in red. The light blue line represents a 12 month moving average that takes the seasonality out of the data and clearly shows a recovery in the Chicago housing market. As you can see last month had the highest sales in 5 years, with the exception of 2009 when the government bribed people to buy homes. Nevertheless, other than this recent past you would have to go back prior to 1997 to find a lower level of sales.
Home Contract Activity
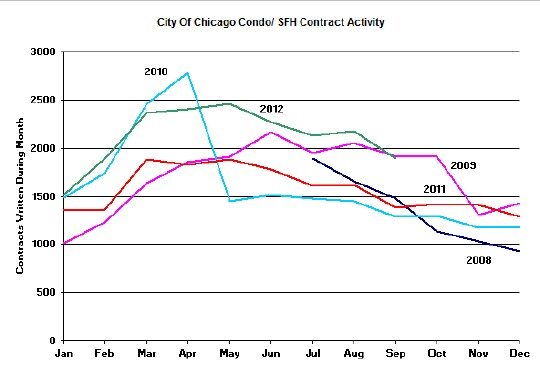
Contract activity continues to be extremely strong, with September 36.9% ahead of last year. As you can see in the graph below this year has seen the highest level of contact activity in the last 5 years, though this last month is right around the level of 2009. But once again, 2009 was a bit of an aberration.
One of the great mysteries of real estate is that for at least 9 months now the growth in contract activity has far exceeded the growth in closed sales. The difference has to be going into pending sales, which now stands at 5464 or 3.0 months worth of closings at the current sales rate. But pending sales are on the decline. On the one hand you would expect that at this time of the year. On the other hand how can pending sales be declining when contract activity consistently grows faster than closed sales? The only thing I know for sure is that this kind of contract activity essentially guarantees that we will have several more months of strong growth in closed sales.
Home Inventories
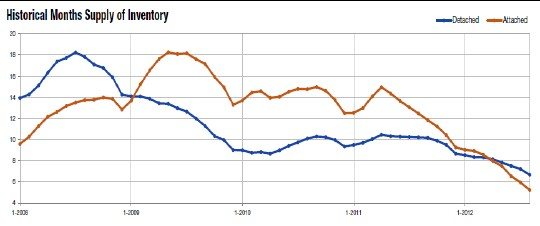
Home inventories continue to plunge in the city of Chicago, reaching a 5.2 month supply of attached homes and a 6.7 month supply of detached homes in August. As you can see in the graph below this is a record low for the past 5 years and this is what is providing upward pressure on home prices right now. This data comes from the Chicago Association of Realtors and they haven’t produced the September numbers yet.
Distressed Property Sales
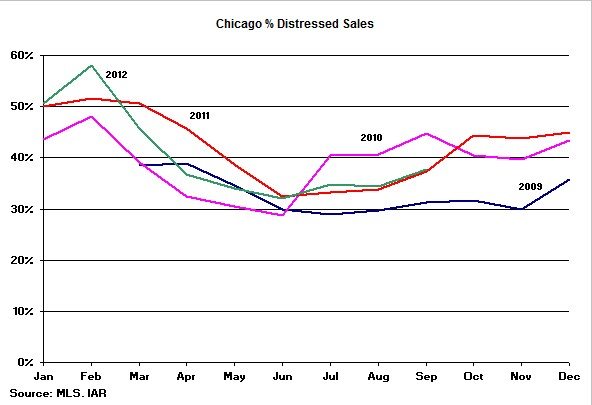
Short sales and foreclosures were 37.6% of the total in September. For much of this year this percentage has tracked with 2011. Despite all the concern about this shadow inventory we haven’t seen any evidence of a dramatic surge in these numbers. Whenever a distressed property hits the market at a really low price someone jumps on it pretty quickly.


