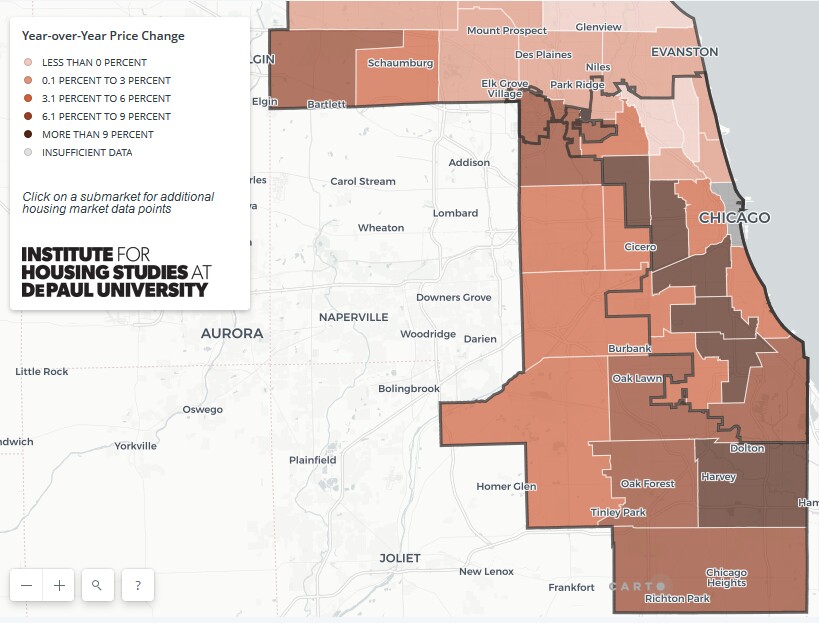
It’s been a little more than a year since I last looked at which Chicago area neighborhoods are the hottest – based upon home price appreciation. I get that data from the Depaul Institute For Housing Studies and they came out with their 2Q 2018 home price indices for 33 submarkets within Cook County back in October so I thought I would update my earlier post. Note that their methodology is summarized in my post from last year but they also go into more detail on their own site.
The map below provides an overview of home price appreciation by submarket during the 12 months ending in June. You can click on it for a larger version. Once again it’s interesting that the areas with the highest appreciation are not the highest income areas closest to the central business district but rather areas further west and south. This is roughly consistent with the conclusions drawn from the October analysis I did of Zillow data by zip code: Chicago’s Highest Appreciating Neighborhoods Will Surprise You. As I’ve always said…you can’t have geographically isolated price appreciation forever. Eventually the effects spill over into adjoining areas.
They also have an interactive graph of the home price trends for each of the 33 submarkets which I’ve incorporated below. You can roll over a line to find out what neighborhood it belongs to and also see the underlying values at various points in time.
There are a few interesting observations:
- The top 3 submarkets in terms of cumulative price appreciation from 2000 are, in order, West Town/ Near West Side (+183.8%), Logan Square/ Avondale (+156.7%), and Lincoln Square/ North Center (+118.8%).
- Growth in those 3 areas has slowed down quite a bit in the last year – and even gone negative in one case. West Town/ Near West Side appreciated at only 5.2% but that is way better than Logan Square/ Avondale that appreciated by only 0.7% and Lincoln Square/ Avondale that actually declined by 0.9%.
- The highest appreciating areas in the last 12 months are actually areas that have historically been depressed: Auburn Gresham/ Chatham (+14.3%), Humboldt Park/ Garfield Park (+12.1%), and Calumet City/ Harvey (+11.7%)
- Humboldt Park/ Garfield Park had the highest peak and a huge drop that it still has not recovered from. It’s still down 36.5% from the peak despite having the highest recovery from the bottom – up 122.9%.
Yeah, I believe that a rising tide eventually lifts all boats.
#ChicagoHomePrices #ChicagoRealEstate
Gary Lucido is the President of Lucid Realty, the Chicago area’s full service real estate brokerage that offers home buyer rebates and discount commissions. If you want to keep up to date on the Chicago real estate market, get an insider’s view of the seamy underbelly of the real estate industry, or you just think he’s the next Kurt Vonnegut you can Subscribe to Getting Real by Email using the form below. Please be sure to verify your email address when you receive the verification notice.
