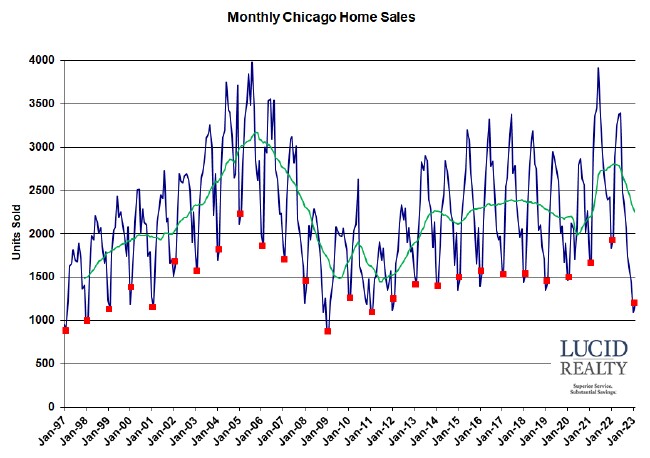
Yeah, the Chicago real estate market had another down month in February BUT not quite as bad as the last two months. Home sales were down only 35.8% from the previous year compared to 40%+ the previous two months. Had it not been for the extraordinary low of February 2011 this would have been a 14 year low. In fact, over the last 22 years only two years had lower sales. However, as I explain below this isn’t as bad as it may sound.
It’s all captured in the graph below with monthly sales going back to 1997, all February points flagged in red, and a green 12 month moving average line that is showing a dramatic plunge since the middle of last year.
When the Illinois Association of Realtors reports the numbers in about 2 weeks they will report a 37.4% decline.
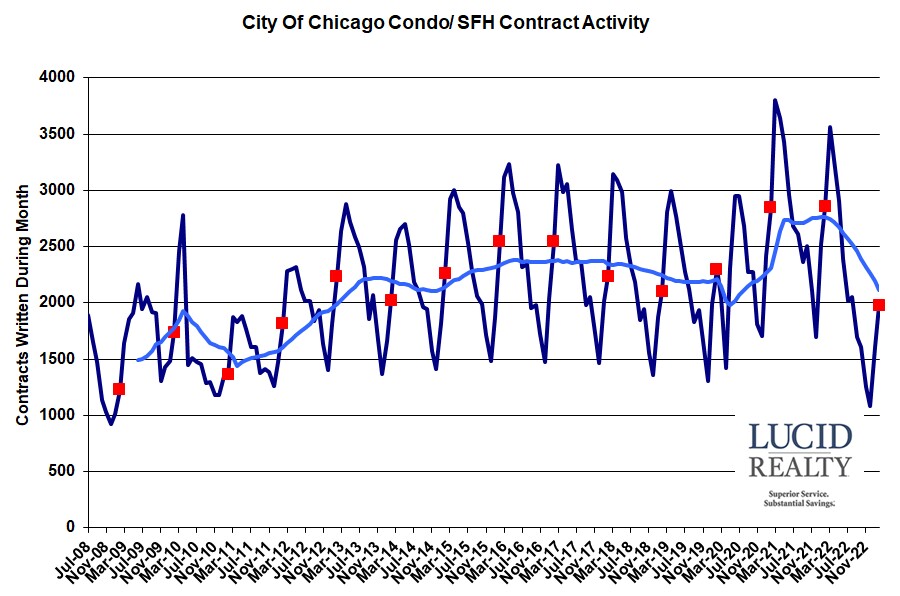
Chicago Home Contract Activity
Looking at the number of contracts written during February it looks like the pressure might be easing just a bit. That’s because contract activity was off only 31.2% from last year, the smallest drop in 5 months. Of course, that’s an 11 year low in contract activity and it also means that closings will likely be pretty low in March again.
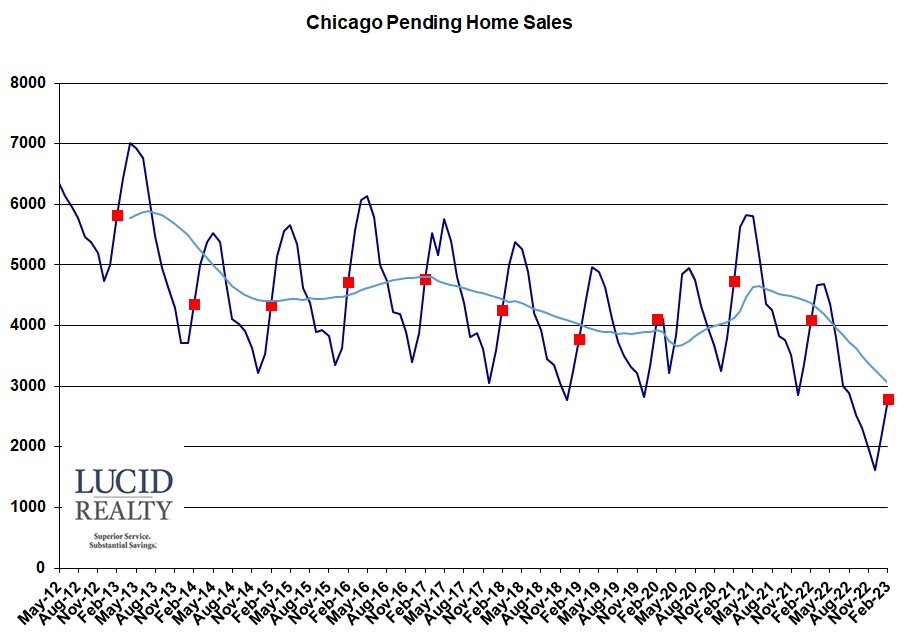
Pending Chicago Home Sales
More bad news for March closings comes from the fact that we hit another low in pending home sales since I’ve been collecting the data. That graph below shows a 1309 unit drop from last year, which represents like 45% of last March’s total closings.
Distressed Chicago Home Sales
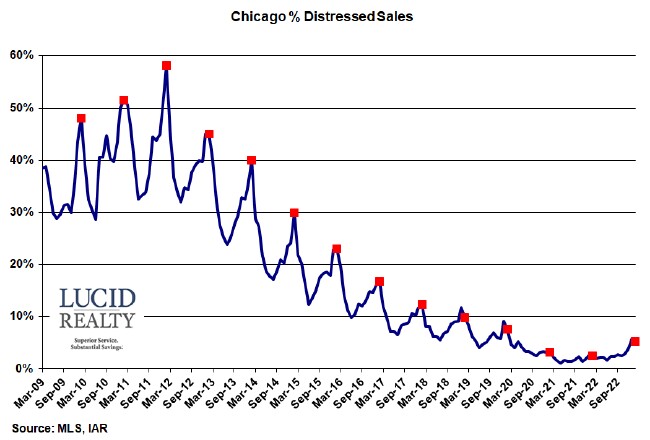
The percentage of home sales that are distressed has gone through its seasonal peak. February’s 5.1% is much higher than the previous two years levels of 3.1% and 2.4% but at least it’s lower than last month’s 5.7%.
Chicago Home Inventory
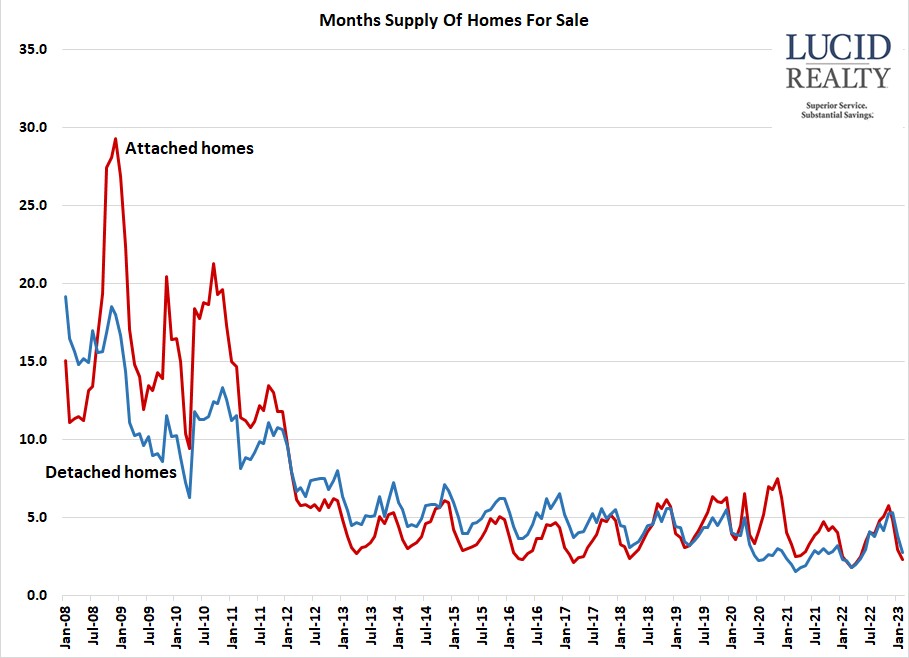
This is where the data starts to look better for the Chicago real estate market. Sure, sales are noteworthy but what homeowners care about are home prices and the market dynamics are still favorable for maintaining values. Inventory levels, expressed in months of supply, are still extraordinarily low by historical standards as you can see in the graph below. In February there was only a 2.3 month supply of attached homes, barely higher than last year’s record low of a 2.2 month supply. Detached homes saw a more significant rise in inventory to 2.8 months of supply from 2.2 months the previous year but that’s still pretty low. For example, the record low was 2.0 months of supply in 2020.
A low months of supply means that there are few homes available relative to demand and that’s good for keeping prices high.
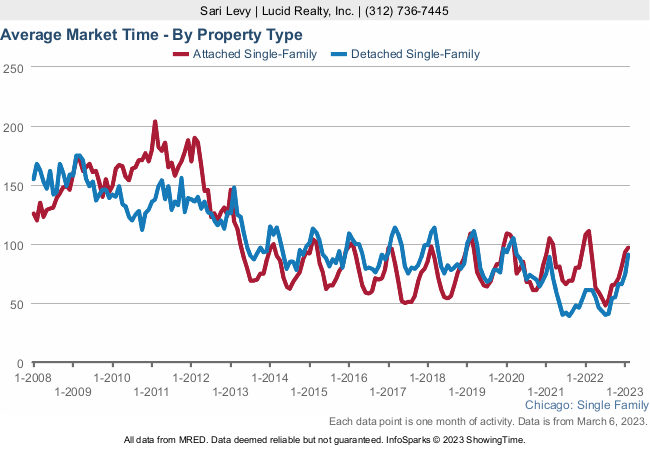
Chicago Home Sale Market Times
The other favorable indicator for home prices is market time, graphed below. The market time for attached homes actually fell to 97 days vs. 111 days last year, which is actually at the lower end of the historic range. And detached market times of 90 days was up significantly from last year’s 61 days but look at where that puts us historically – almost the same as 2021 and lower than the entire period prior to that. Not bad if you’re trying to sell a home.
