Zillow just came out with their ranking of the top 10 home sellers’ and home buyers’ markets across the country and the Chicago metro area showed up as the top buyers’ market. Obviously Zillow has not been trying to buy a house in the Chicago area lately. Anyone who has can tell you it’s not that easy – primarily because of lack of inventory – the real indicator of whether or not you have a buyers’ or a sellers’ market.
Zillow came to their conclusion by comparing largely meaningless data:
- Sale to list price ratio
- Percent of homes on the market with a price cut
- Number of days listings were on the market
Garbage in, garbage out.
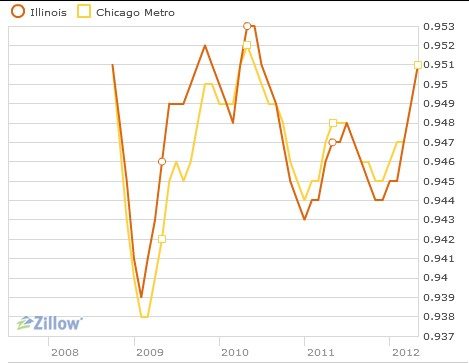
Sale To List Price Ratio
This number is just as useless as it is when realtors use it to lie about their ability to sell your home. Like maybe it has something to do with how cheaply homes are priced to begin with? Furthermore, at 95.1%, it’s not that low and it’s actually at the higher end of the range of the past 4 years.

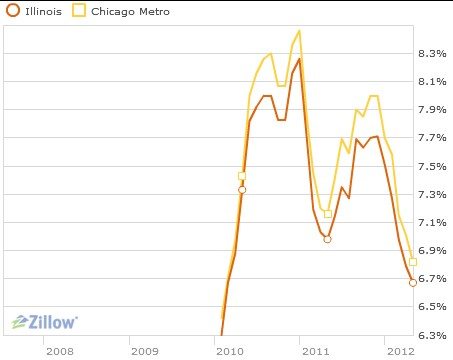
Percent Of Homes On The Market With A Price Cut
Again, this is another number that is heavily impacted by how high homes are listed to begin with. And, as you can see in the graph below, the percentage has actually been drifting down overall. Not terribly meaningful.

And the size of these price cuts is actually the lowest it’s been in 3 years.
Let’s face it, all this really proves is that, if anything, home sellers and their real estate agents are pricing homes more realistically these days.
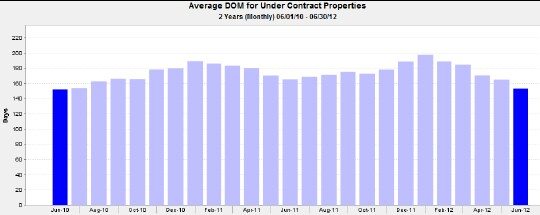
Number Of Days Listings Were On The Market
Another meaningless number that really only reflects how realistically homes are being priced by sellers, this one is not graphed on the Zillow site for some reason. So I pulled the data myself for the Chicago metro area and, at 153 days for listings that actually sold, the market times are as low as they have been over the last 2 years.
The Real Indicator Of A Buyers’ Market
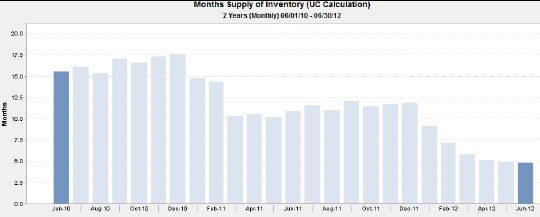
If you really want a sense of whether or not it’s a buyers’ or sellers’ market take a look at inventory levels – something that Zillow did not look at. As anyone who has been looking for a home lately can tell you there is a real shortage of good homes out there right now and the graph below confirms it. On a months of supply basis we are at the lowest level of the last 2 years with only 4.8 months of supply available. And that’s pretty low on an absolute basis as well.
But I’m not about to call it a seller’s market either because there is little evidence of rising prices yet but it’s certainly not a buyer’s market either.


This is Alison from Zillow. I wanted to clarify the purpose of this analysis, which is to determine who has the upper hand at the negotiating table in a given market: buyers or sellers.
Your point about the metrics we used, like sale to list price ratio and percent of listings with price cuts, being affected by how realistically sellers are pricing their homes, is true. But, if sellers are pricing their homes poorly, they’re giving buyers more power. When buyers see lots of price cuts on lots of homes (in May, 39 percent of homes in Chicago had at least one cut, whereas in the seller markets we identified less than 20 percent of homes had price cuts) they tend to think they have more room to negotiate on price. Likewise, the longer a home sits on the market, the more room a seller feels they have to negotiate. The number of days listings are on Zillow in the Chicago metro is three times that of strong seller markets.
Now, with all that being said, it is important to drill down and look at these metrics on a city level, which we have available here: http://www.zillow.com/blog/research/2012/07/10/understanding-the-zillow-buyer-seller-index/
Finally, we’re not saying that things aren’t getting better in the Chicago metro because according to our data, they are. In fact, we show home values rising 1.1 percent from April to May. What we are saying is that, as of May, out of the 50 largest metros we track, buyers in the Chicago have the most negotiating power when purchasing a home.
Thanks for the additional perspective on your data.
Traditionally realtors have determined whether a market is a buyers’ market or sellers’ market based upon the inventory levels. This is one of the few traditional views of real estate that I adhere to. I’ve seen some sources claim the crossover point is 6 months. On this basis Chicago has transitioned to a sellers’ market – though I’m not sure I’d go that far.
Your position is basically that when sellers overprice their home they give buyers more power. I can’t agree with that. No one has power in that situation. The buyers can’t force the sellers to drop their prices. And if homes are all overpriced then it’s not really a buyers’ market.
I think Chicago is actually a bifurcated market where half the homes for sale are overpriced and not moving but the other half is priced correctly and sells quickly.
What area is Zillow using to come to their conclusion? Chicago’s MSA often contaminates the data because it is so broad and doesn’t reflect reality.
In my experience over the past several months, single family homes in the city (basically the greenzone neighborhoods) are in high demand and certainly not a “buyers market” given the multi-offers that have been occuring. I’ve also seen high demand for 3 bedrooms too.
In all likelihood when Zillow refers to the Chicago metro area they are probably referring to the PMSA which includes the 9 counties.