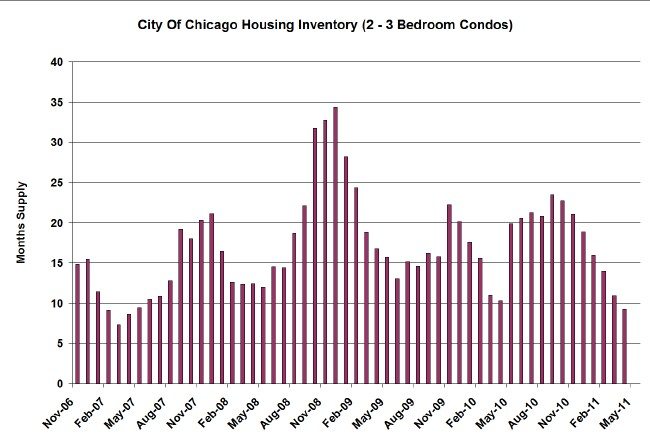
Although I just posted on how Chicago home prices continue to fall at a very rapid rate there is a positive sign on the horizon. It would appear as though Chicago home sellers have finally had enough of falling prices and are refusing to put their homes on the market – they’ve drawn a line in the sand. We just updated our home inventory analysis for 2 – 3 bedroom condos in the city of Chicago and 15 of our focus neighborhoods (see links at the bottom) and the data is rather dramatic. As shown in the graph below, the April months of supply of 2 – 3 bedroom condos hit a new 4 year low at 9.2 months of inventory. However, there is one big caveat with this number. It is based upon current contract activity and once the April contracts season a bit we will see about a 15% reduction in activity as a result of cancelled contracts. So that 9.2 number might become 10.8. But that’s still relatively low and the downward trend in inventory is unmistakable.
The reason that inventory levels are so important to monitor is that they hold clues as to the future direction of home prices. Last night I listened to a pretty interesting (OK, “interesting” is relative) CoreLogic Webinar on using home inventories to forecast home prices. They use this home inventory data in a regression model to produce price forecasts that they sell to clients. But you don’t have to get all statistical to know how to interpret the home inventory data. One of the more interesting points that comes out of the Webinar is that they basically confirm the conventional wisdom of realtors (maybe realtors aren’t so dumb after all?) regarding the difference between buyer’s and seller’s markets:
- < 5 months of inventory = seller’s market
- 5 – 7 months of inventory = balanced market
- > 7 months of inventory = buyer’s market
Although it’s not clear how to adjust this rule of thumb for the obvious seasonality of the data it’s clear that we have been in a buyer’s market for as long as I’ve been tracking the data. However, is it possible that we are on the verge of returning to a seller’s market?
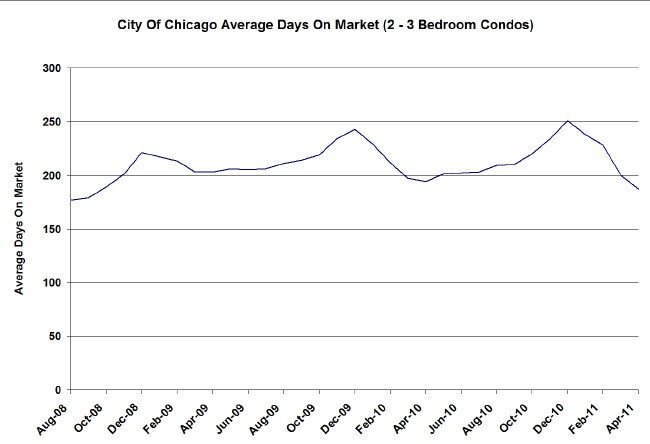
Another slightly positive indicator for Chicago real estate is the market times. Although the trend is not nearly as clear as for the inventory levels above, you can see that in April the number of days on the market dipped to the lowest level in 3 years for this time of year. It’s too soon to tell if this is a real trend or not but it is a nice indication.
Here are links to the inventory and market time data for 15 Chicago neighborhoods that we track. This data is hot off the press so, while the data on these pages has been updated, the commentary has not yet been updated.

