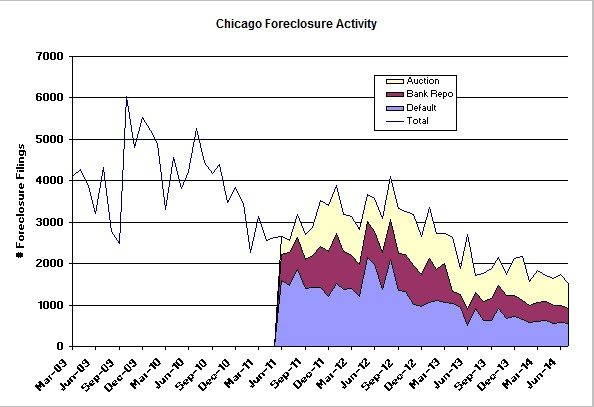
RealtyTrac released their July Foreclosure Market Report yesterday and the data for Chicago foreclosures continues to show a bottoming in activity. When you look at the long term graph below, which breaks down the activity into the three basic components, you can see just how far we have come – less than half the peak activity of 2 years ago and a third of what it was in 2009.
At a national level Daren Blomquist, vice president at RealtyTrac, also points out that the decline in foreclosure activity is slowing down:
July was the 46th consecutive month where U.S. foreclosure activity was down on a year-over-year basis. After nearly four years of falling foreclosures, we are starting to see evidence that foreclosure numbers are normalizing at the national level. The 16 percent decrease in July was exactly half the annual decrease we saw a year ago in July 2013, when U.S. foreclosure activity was down 32 percent on a year-over-year basis.
The number of state and local markets with persistent foreclosure problems is becoming fewer and farther between, although there were some surprise spikes in foreclosure activity in July in markets that had previously been experiencing long-term downward trends in foreclosure activity.
This one graph of the annual percentage change in activity by month from their report puts the trend in stark perspective (you can click on it for a larger view):
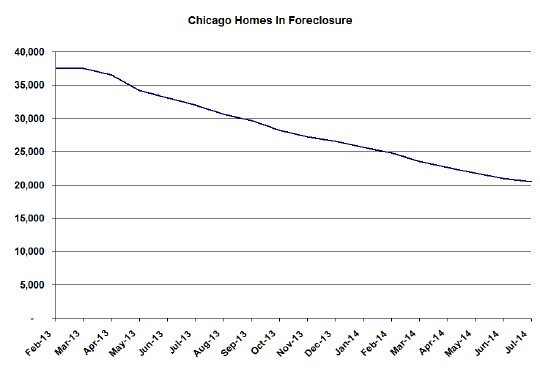
Chicago Shadow Inventory
We’re also seeing the bottoming in the decline in Chicago’s shadow inventory. It’s hard to see in the graph below but a year ago the shadow inventory was dropping by 1000 homes per month. Now it’s only dropping by about 500 per month. At least it’s still declining but at some point it’s going to go flat as we reach equilibrium between new foreclosures and sales.
Along these same lines the RealtyTrac report also includes this graph of US foreclosure starts and completions. What’s interesting is the gap between starts and completions and the fact that it’s narrowing. I assume the persistent gap is explained by short sales and loan modifications that would probably not be considered completions. So the narrowing of the gap seems to imply that there are fewer short sales and loan modifications taking place as a percentage of all foreclosure starts.
#foreclosure
If you want to keep up to date on the Chicago real estate market, get an insider’s view of the seamy underbelly of the real estate industry, or you just think I’m the next Kurt Vonnegut you can Subscribe to Getting Real by Email. Please be sure to verify your email address when you receive the verification notice.


