I’ve been doing a series of posts lately on new home construction in Chicago and just based upon the level of activity I’ve been seeing while driving around I thought for sure things were pretty hot. A client of mine even contacted me to tell me that he was having trouble finding contractors to do projects because they were so busy. The contractors were telling him that not only was there more activity recently but there were also fewer contractors to do the work because so many of the weak players had gone out of business.
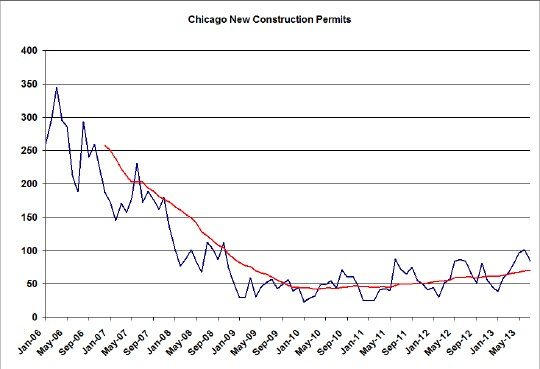
As we discussed the interesting dynamics at play here it dawned on me that I could actually look at construction data for Chicago. I started by looking at new construction building permits and created the graph below which tabulates the number of these permits issued by month going back to January 2006 and running through the end of July 2013 along with a red 12 month moving average line to smooth out the fluctuations and seasonality. Now keep in mind that this is all new construction, including commercial, but it’s still a good indicator of the overall health and growth of Chicago.
Yes, new construction has been on the upswing in the last couple of years but look how far it has to go to catch up to where it was at the peak in 2006. It’s fallen from an average of around 250 per month to under 50 per month and is now somewhere around 75 per month. I don’t even know if it can ever catch back up to the 2006 peak, which was more than three times higher than it’s current level.
But it’s also really interesting to note where the new construction has been and is about to take place so I mapped it for the last 6 months and then compared it to the the first 6 months of 2006, which was the peak of activity in my data set. In the last 6 months 491 new construction building permits were issued compared to 1692 for the first 6 months of 2006. The interactive map below looks at where the permits of the last 6 months have been issued and if you click on the markers it gives you more information about these projects. However, don’t pay too much attention to the estimated cost numbers because they can be bogus – like someone is really building a restaurant for $1.00. Whoever put that down on the application probably thinks they’re going to keep their property taxes down that way.
You can click here to get a larger version of my Chicago new construction map for the last 6 months.
As you move around this map you will plainly see that there is very little happening below 59th Street and it really picks up north of Grand, where most of the activity is actually west of the Kennedy. That makes sense since land is a lot cheaper there and plenty of teardowns are available. In fact, as I’ve been preaching, East and Ukrainian Village are major hots spots with 19 permits issued in my own neighborhood between Ashland and Western and Grand and Chicago.
Another major hotspot of note is the area north of Augusta where the new development has pushed all the way west to Kedzie, with a major concentration between North and Cortland. I’m not surprised since this is really close to Humboldt Park (the actual park), which is a totally under appreciated asset of Chicago. I never paid much attention to it before but driving through it during the summer you can’t help but remark how beautiful and well maintained it is.
And then as you look east and north you see that there is a huge concentration of new development east of Clybourn and Western. What I find a bit surprising about this is that there seems to be a never ending supply of teardowns in these well established neighborhoods – even Lincoln Park.
So let’s look at where the new construction was in the first half of 2006 in the map below. Of course, there was much more overall activity at that time but you can see that a lot more activity was going on at the western and southern ends of the city back then and it looks to me like there wasn’t that much more activity going on in the higher income neighborhoods to the north and east. Either the more affluent neighborhoods are leading the recovery now or the less affluent neighborhoods are dragging behind. And my neighborhood had the same activity level back then that it does now – 19 permits in a 6 month period.
You can click here for a larger version of this Chicago new construction map for the first half of 2006.
If you want to keep up to date on the Chicago real estate market, get an insider’s view of the seamy underbelly of the real estate industry, or you just think I’m the next Kurt Vonnegut you can Subscribe to Getting Real by Email.
