As you might expect the answer is “it depends”. And up until a few weeks ago I couldn’t even easily answer the question because a while back I discovered that there were some serious problems with the Multiple Listing Service data over the past few years and this has caused many realtors to provide incorrect answers to this question for quite some time. After calling attention to the problem I had to wait for the data provider to fix this.
The first thing to consider is that a certain percentage of Chicago homes that are put on the market just don’t sell because the sellers give up. What’s the percentage? I really don’t know for sure. It turns out that there is no easy way to figure this out because listings expire or get canceled all the time, only to be reincarnated as a new listing immediately or soon thereafter. 58% of the listings that went live in August 2009 either expired or were canceled within a year. A large percentage of these (I dunno, maybe half?) were replaced with new listings and sold within that year.
So the only way to really analyze market times is to look backwards at
the houses that actually sold and see how long it took them to sell. The
only problem with this approach is that it reflects not only the current Chicago real estate
market conditions but also all the market conditions leading up to the
sale of those properties. Nevertheless, the answer is………for all
homes sold in August 2010 in the city of Chicago on average it took
them 148 days to sell. And yes that takes into account listings that
expired or were canceled and then put back on the market (unless they
were off the market for 90 days or more, in which case it’s considered a
new attempt all together). BTW, this number appears to have been pretty
steady over the last couple of years and I suspect that it’s been
pretty steady even longer than that. However, I remember 4 years ago the
management of a large Chicago real estate brokerage claiming that homes
were selling in 90 days. However, since then the MLS data provider
fixed some other errors in their market time calculations (yeah, there’s a pattern), after which
the market times shot up.
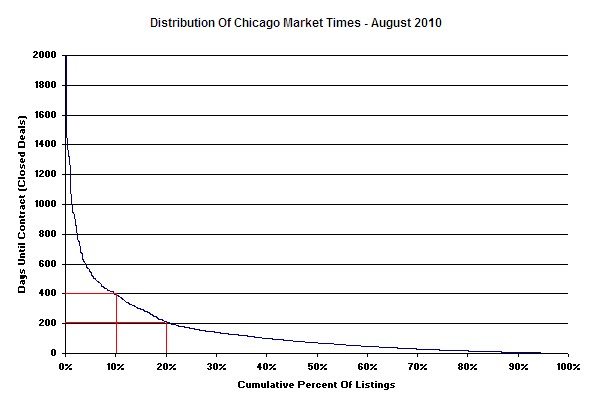
But 148 days is an average and we all know that averages don’t tell you much. They sort of mush all the information together. So let’s look at the distribution of market times in the graph below, which sorts all the closings by market times:
What we see from looking at this chart is that 10% of the listings took more than 395 days to sell and 20% took more than 214 days. Of course that also means that 80% of the listings sold in less than 214 days.
But most homes did not sell during August. As a point of comparison, the data above is for
the 1512 homes that did sell in August but there were still 25,519 homes that haven’t yet sold and they have been on the market
for an average of 170 days. (They’re waiting for the market to come back
🙂 ) And don’t forget that a sizable but unknown percentage of listings will never sell because the sellers give up altogether.
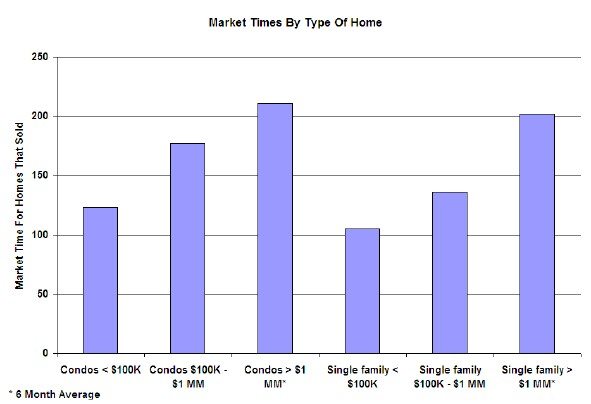
Of course, how long a home takes to sell in Chicago depends largely upon what type of home it is. As you can see in the chart below, where we break out different types of home, the larger, more expensive homes take longer to sell.
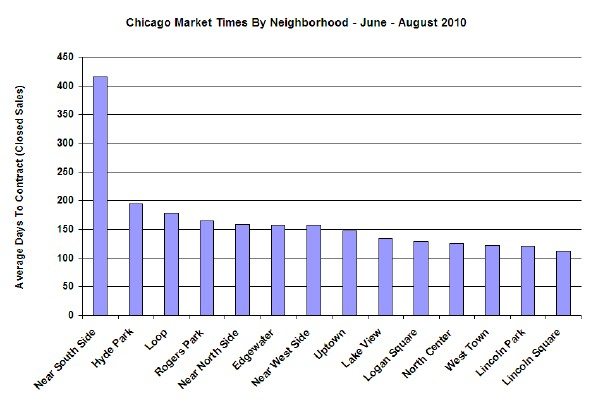
And what about neighborhood? As you can see from the graph below it makes a big difference where your home is. I picked some of the more popular Chicago neighborhoods where we focus and pulled the average market times over the last 3 months (there aren’t enough closings in one month to give you a decent average). I also restricted the analysis to homes between $100K and $1 MM in order to minimize the impact of extreme price variations that might exist in these different neighborhoods.
Not surprisingly, the Near South Side, which includes the infamous South Loop, has the longest market times at over 400 days. However, that data is skewed by a lot of closings at Museum Park and Museum Park Place II, where the units have been on the market forever. Nevertheless, it’s interesting to see the variation between the different neighborhoods. For instance, I would not have expected Lincoln Square to be doing so much better than the Loop.
So, as I said in the beginning…it depends.


