Back in September Crain’s ran a story about how downtown Chicago condo prices had returned to peak levels. Their conclusion was based upon data from a pretty reliable source: Appraisal Research Counselors, who looked at more than 65 different condo buildings in downtown Chicago. ARC pointed out that within 65 buildings prices per square foot were within 4.3% of their 2008 peak. I think they were looking at prices for the first half of 2014.
Let me point out that ARC was looking at Chicago condo prices per square foot, something that a pack of appraisers jumped on me for in a previous post about bad appraisals.
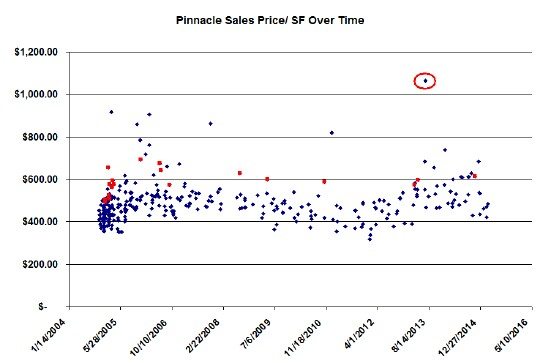
Anyway, I’ve seen so many underwater condos – even now – that I had to look at some of this data myself. Not to mention that I have a hard time believing data if I haven’t seen it myself. I decided to start with a premier building – The Pinnacle at 21 E Huron. And, yes, I looked at prices per square foot. But I’m reluctant to use averages because averages lose all the individual nuances. Therefore, I took all the Pinnacle sales from the beginning of time and dumped them into a scatter diagram over time so that we could see the distribution of individual sales. I also flagged all the large 04 units with red squares since these units carry a premium per square foot because of the view and the floor plan.
You can get a pretty good idea of the averages by eyeballing the graph. A few patterns become clear:
- You can see the pre-construction cluster of sales at the very beginning. Those occurred at some discount to later sales.
- Prices drifted down, starting in 2008 and running through the middle of 2012
- Then prices started rising until very recently. The most recent sales seem to be at lower prices/ sq ft but there are too few data points to really draw that conclusion.
- The recent peak in prices seems to be higher than what was hit in the 2008 timeframe
- You can clearly see the premium pricing on the 04 units
- The total decline in pricing at the Pinnacle seems to have only been about 20%, whereas Chicago condo prices fell by 40% on average from peak to trough according to the Case Shiller index. So a premier building like this didn’t fall as much as the average to begin with and didn’t have as much ground to recover.
One other interesting side note…see that outlier I circled in red on the graph? I’ve previously written about that penthouse unit, which was sold above $1000/ sq. ft. by an extremely colorful couple, and was totally pimped out so to speak – very tastefully though.
#ChicagoRealEstate #RealEstate #ChicagoCondos
If you want to keep up to date on the Chicago real estate market, get an insider’s view of the seamy underbelly of the real estate industry, or you just think I’m the next Kurt Vonnegut you can Subscribe to Getting Real by Email. Please be sure to verify your email address when you receive the verification notice.
