There is an updated version of this post with data through June 2021 here: Chicago Murder Map And Neighborhood Totals – 2021 Update
We get these questions all the time from potential Chicago homebuyers: Is this neighborhood safe? What are the safest neighborhoods? And then plenty of people just want to know for the heck of it which neighborhoods are the most dangerous. I assume they’re just curious and not really interested in moving to those dangerous neighborhoods.
The problem is that it’s certainly not possible to give our stamp of approval to any particular neighborhood. There are few absolutes in this world and “safe” and “dangerous” are not among them. And even relative comparisons are difficult except at the extremes.
So, instead, once a year I pull a year’s worth of crime data from the city of Chicago portal and present it in an easily digestible fashion so that people can decide for themselves whether or not they would be comfortable living somewhere. These are, in fact, the most popular of my blog posts. I always kick off this exercise with the murder statistics from the last 12 months (July 2018 – June 2019).
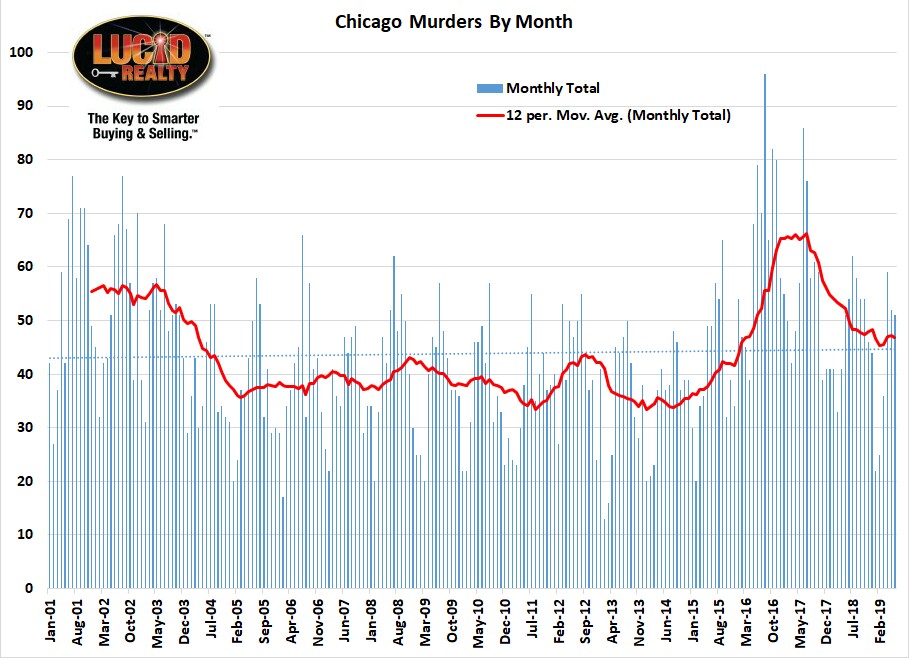
First, let’s put it in historic perspective. The graph below shows the number of people killed in Chicago by month and, as you can see, there is a strong seasonal pattern. Apparently the heat really puts some people in a bad mood. Or maybe it’s really uncomfortable holding a cold metal gun. Anyway, that’s why there is a red 12 month moving average line in the graph also – to smooth out the seasonal pattern and allow us to see the overall trend.
What this graph shows is that there was a significant spike up in the 2016 – 2017 timeframe, that we have somewhat recovered from, but we are still running higher than we did for about a decade in the middle of the graph. I counted 563 murders in the 12 month period ending June 30.

Chicago Murder Rate By Neighborhood
So let’s look at murder by neighborhood first – well, actually, by community area. You can click on the graph below and it will expand to a more legible size. In order to normalize for the populations of the community areas I calculated a murder rate per 100,000 people and then sorted the community areas from lowest murder rate to highest.
Surprisingly, there are 11 community areas that had no murders in them but that’s actually down significantly from 19 last year at this time. Spot checking a lot of the community areas it looks to me like the rates didn’t change that much from the previous year – except at the high end of the range. For instance, I did notice that North Lawndale dropped quite a bit. Conversely, East Garfield Park jumped up by a lot, rising to #6 on the list from #8 last year. In fact, there are 6 community areas this year with rates above 100 vs. only 1 last year.
It is interesting to note that the murder rate/ 100K dropped in the Lower West Side, which includes Pilsen – from 19.6 last year to 2.9 this year. Damn that gentrification! It’s “changing the character of the neighborhood” just like Danny Solis feared.
And Fuller Park topped out the list this year with 157.3 murders per 100,000 people vs. only 31.1 last year. However, in the case of Fuller Park the data can be deceiving. It has such a low population that a single murder swings the rate by 39 per 100,000. They only had 4 murders last year.
Map Of Chicago Murders
While the murder rate by community area is interesting the incidence of murders can vary substantially within a community area depending on the neighborhood (in the true sense of “neighborhood”). That’s why I always plot out the murders on a map – see below. This map allows you to pan and zoom, open a full page version of the map, share it, and you can click on each of the balloons to get more information on the homicide.
When you zoom in you can see for instance that all the murders in Humboldt Park actually took place south of Grand Avenue. And none of the West Town murders took place in Wicker Park.
#ChicagoCrime #ChicagoMurders #ChicagoHomicide
Gary Lucido is the President of Lucid Realty, the Chicago area’s full service real estate brokerage that offers home buyer rebates and discount commissions. If you want to keep up to date on the Chicago real estate market or get an insider’s view of the seamy underbelly of the real estate industry you can Subscribe to Getting Real by Email using the form below. Please be sure to verify your email address when you receive the verification notice.