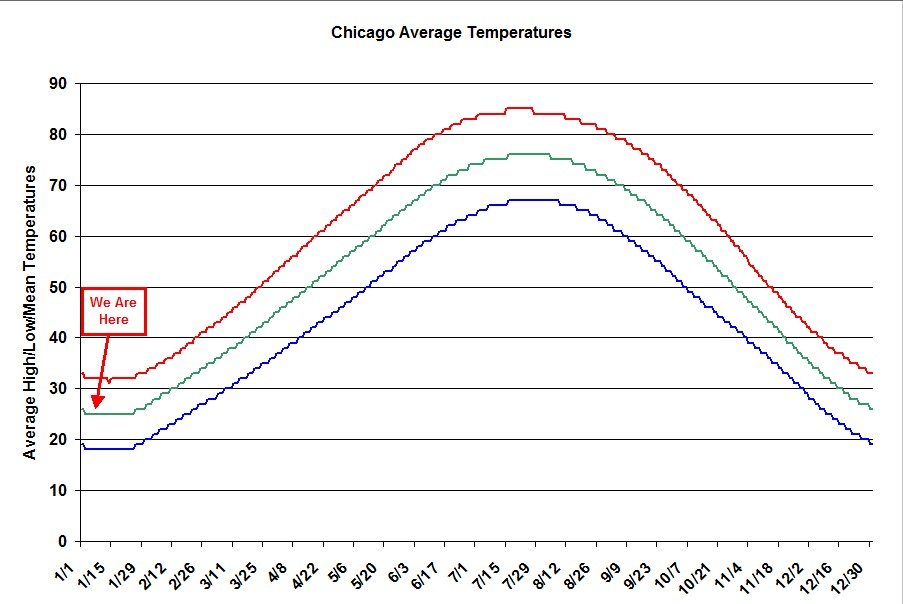
God I hate Chicago weather! Yeah, I grew up in Dallas. So every year at this time I pull up a handy dandy chart that I created that shows the average high, low, and average temperatures in Chicago by day. And as you can see from the graph below (it’s clickable so you can see a larger version) we are in the worst time of the year. We hit the lows on January 3rd and stay there until the 26th, which is the first day that temperatures start to rise. January 14th is technically a little bit colder than the rest of those days but not by much.
So if we can just muddle through for 18 more days – on average – things should start to get better. The days have already started to get longer but the temperatures lag that phenomenon a bit.
It’s nice to be able to at least know that there is a light at the end of the tunnel.

#ChicagoWeather #ChicagoTemperatures
If you want to keep up to date on the Chicago real estate market, get an insider’s view of the seamy underbelly of the real estate industry, or you just think I’m the next Kurt Vonnegut you can Subscribe to Getting Real by Email. Please be sure to verify your email address when you receive the verification notice.