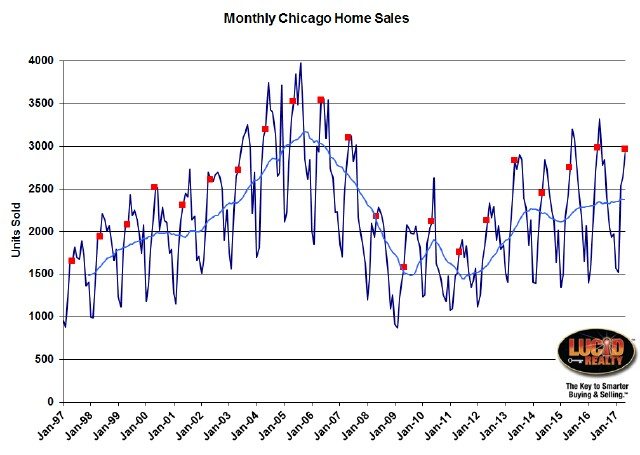
According to the recent see saw pattern of alternating high and low home sale months the Chicago real estate market was due for strong sales in May. But it didn’t happen. Instead we got a mere 3.0% increase over last year, though it was the second highest sales month in 10 years.
You can’t really see that there’s an increase in the graph below because I’m using up to date historic information and preliminary data for May – much like the way the Illinois Association of Realtors does it. However, when you compare preliminary information to preliminary information you see the 3.0% increase.
And speaking of the IAR they will release their numbers in 2 more weeks and using that methodology they will report a 0.2% decrease in home sales.
Once again, the most meaningful insight from this graph comes from that light blue moving average line which shows a steady but slow climb.

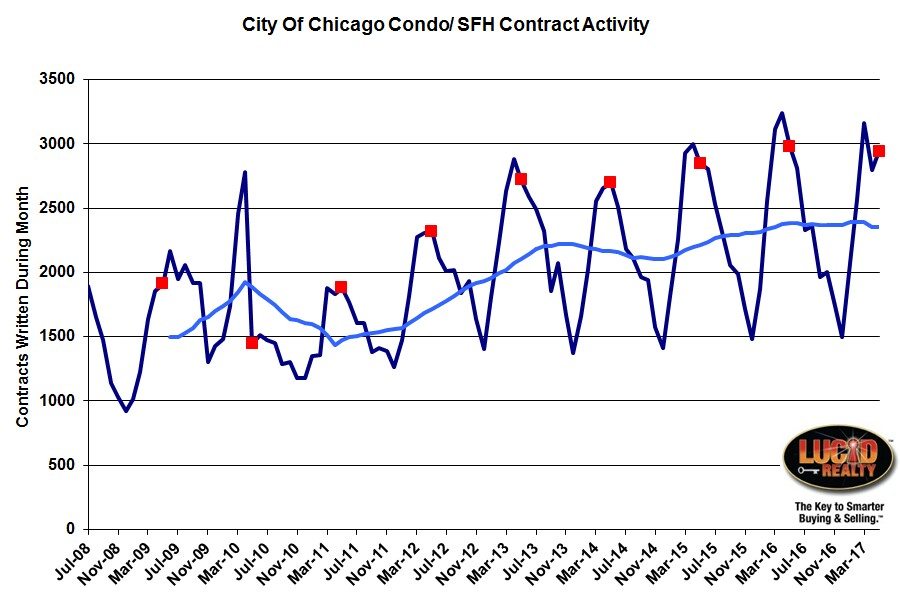
Chicago Home Contract Activity
As has been the case for some time now contract activity has been disappointing. I’m estimating a 1.7% decline in May after a much larger decline in April, which probably partly explains why May closings were so weak. You can see that the light blue moving average line below has been trailing off recently.
It’s ironic though that Crain’s keeps reporting on the Record number of city homes under contract. I think the problem is that they are not factoring in the expected attrition on those contracts. This makes the historic comparison perpetually favorable simply because the historic numbers reflect ~15% attrition whereas the most recent numbers don’t have that baked in yet.
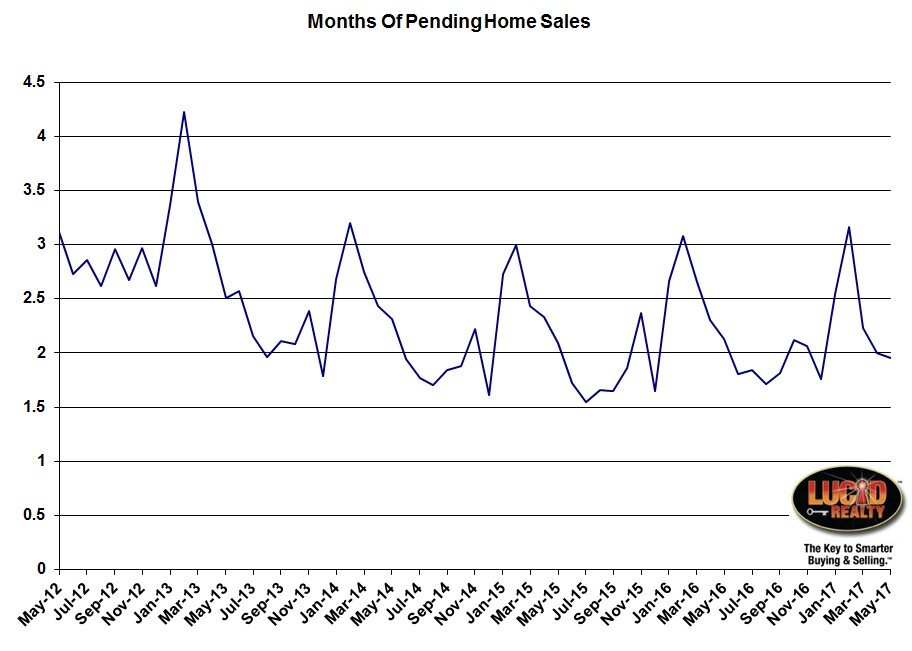
Pending Home Sales
By examining Chicago’s pending homes sales it’s apparent that closings were not diminished by postponing closings into future months. In fact, May ended with a 1.94 month supply of closings compared to a 2.13 month supply last year. However, we did enter May with an exceptionally low supply of pending home sales and that probably hurt closings.
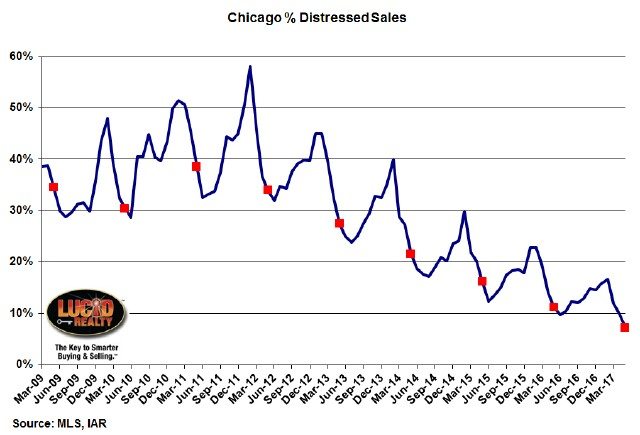
Distressed Home Sales
As has been the case forever, distressed home sales hit another 9 year low of only 7.2% of home sales. We’re getting really close to the bottom here.
Chicago Home Inventory
And Chicago home inventory levels also keep hitting record lows which can’t be helping home sales. May ended with only a 3.0 month supply of attached homes for sale, compared to a 3.4 month supply last year. Detached homes ended at a 4.3 month supply compared to a 4.7 month supply last year. Both numbers are extraordinarily low.
Chicago Home Sale Market Times
How long it takes to sell homes in Chicago is only somewhat consistent with our low inventory levels. The attached homes that sold did so in only 51 days on average compared to 65 days a year ago, which is pretty darn quick. Detached home market times went in the other direction though which was a bit surprising. They sold in 99 days vs. 92 days a year ago, which is not consistent with a low and decreasing inventory.
#RealEstate #ChicagoRealEstate
Gary Lucido is the President of Lucid Realty, the Chicago area’s full service discount real estate brokerage. If you want to keep up to date on the Chicago real estate market, get an insider’s view of the seamy underbelly of the real estate industry, or you just think he’s the next Kurt Vonnegut you can Subscribe to Getting Real by Email using the form below. Please be sure to verify your email address when you receive the verification notice.


