Chicago Home Contract Activity
Contract activity also remained strong as you can see in the graph below, approaching a record high. The record was actually set last year after the initial shock of the pandemic wore off and the Chicago real estate market caught fire. It looks like last month was off all of 1.3% from last year. But the moving average line tells us that the last 12 months by far have had the strongest contract activity since I’ve been tracking it.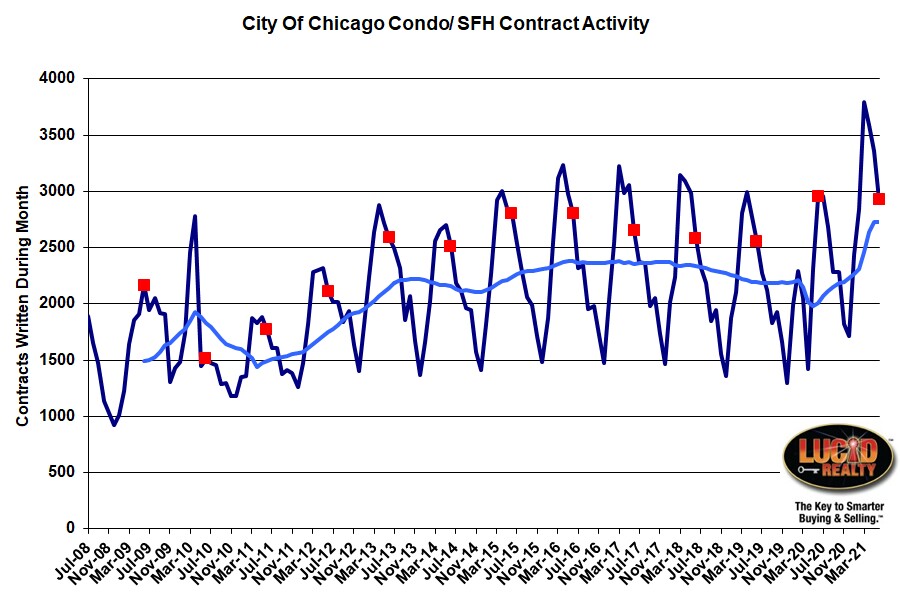
Pending Home Sales
The homes that have gone under contract but have not yet closed end up in the pending home sales bucket. Eventually they will end up as closed sales so an increase in this number gives us plenty of good reasons to be optimistic about future sales. Last month was higher than the previous year (which was not negatively impacted by the pandemic) by 325 units.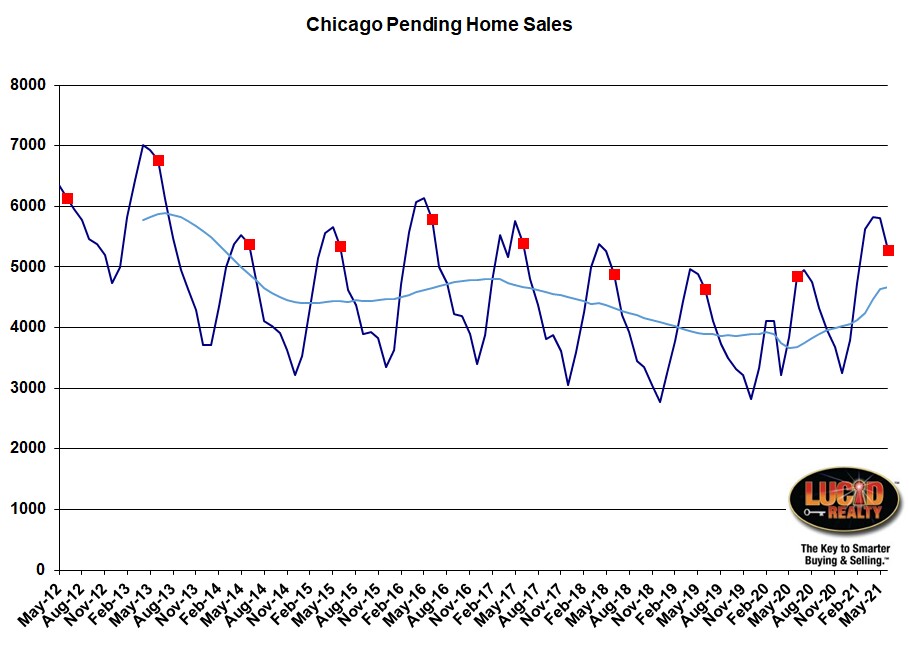
Distressed Home Sales
As has been the case for some time – especially with the pandemic induced moratorium on foreclosures – the percentage of home sales that are distressed has dropped to miniscule levels. June came in a little higher than May at 1.6% but that’s quite a bit lower than last year’s 4.2%.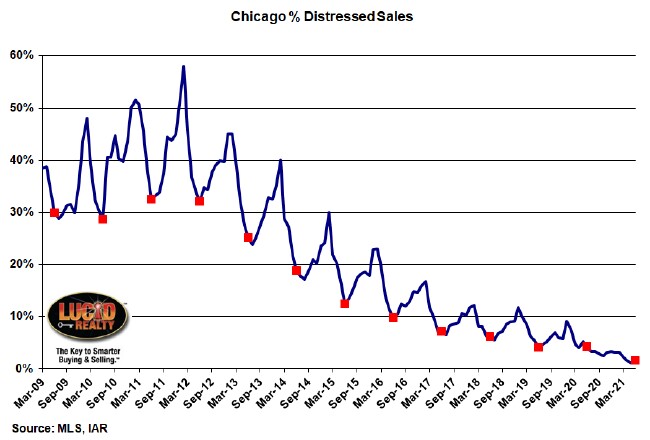
Chicago Home Inventory
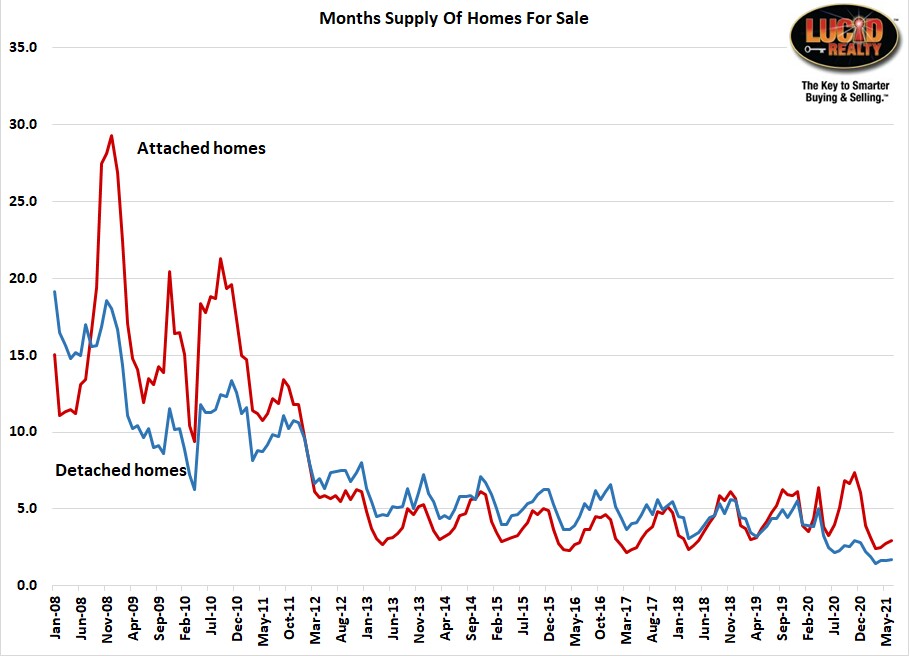
The inventory of homes available for sale in Chicago remains a constraint on the real estate market. I’m still using my own calculation because I think the standard reported metrics have issues and you can see just how crazy low it has been in the graph below. Detached home inventory was at a mere 1.7 month supply – near the lowest levels recorded and June is not typically the low point of the year. Attached inventory was a bit higher at 2.9 months but that’s still exceptionally low for condos in June.