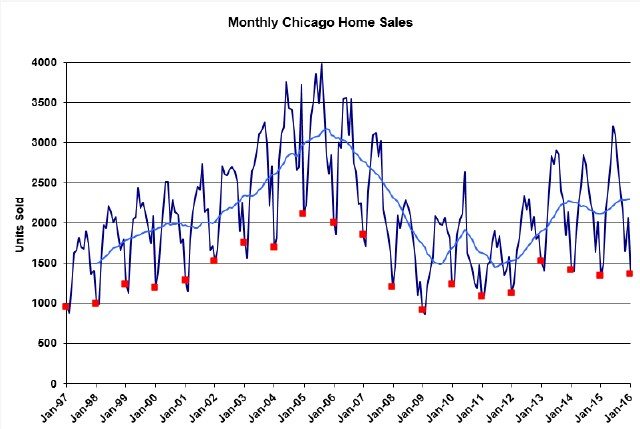
After 3 months of stagnant home sales relative to the previous year the Chicago real estate market finally delivered a stronger January that came in 5.3% higher than last year. Yeah, that’s not much to brag about really but it is a decent number. However, the Illinois Association of Realtors will report growth of approximately 1.1% when they report in 2 weeks – the discrepancy has to do with a flaw in their methodology.
The graph below contains monthly Chicago home sales going back to January 1997 with all the Januarys flagged as red squares and a blue 12 month moving average line. As you can see from that moving average line sales have really leveled off in the last couple of years and the last 4 Januarys have all pretty much been stuck in the same range. In fact, the last 3 Januarys have all been lower than January 2013.
Chicago Home Contract Activity
You can see that the market has slowed down over the last 4 years by looking at the home purchase contract activity, which leads actual closings by 1 – 2 months. I’m estimating that January contract activity was down from last year by 5.2%. Based upon my current estimates I’d say that that is the worst activity level in the last 14 months and does not bode well for sales over the next month or two.

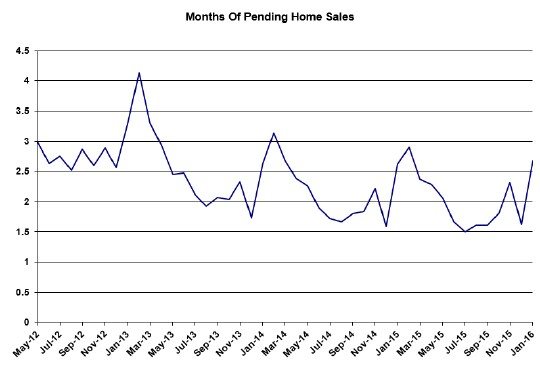
Pending Home Sales
Despite higher sales and lower contract activity we actually had a slight increase in pending home sales – from a 2.62 month supply last year to a 2.67 month supply this year. But that’s not a huge difference and won’t have an appreciable impact on future closings.
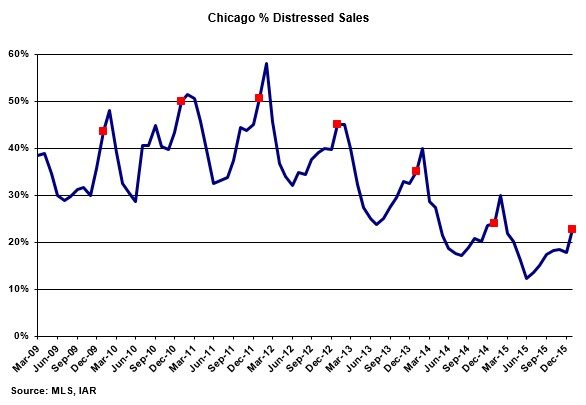
Distressed Home Sales
The decline in distressed home sales as a percent of the total marches on but it’s clearly running out of steam as you can see in the graph below. You can only go so low. January set another record low of only 22.8% distressed sales vs. 24.1% last year.
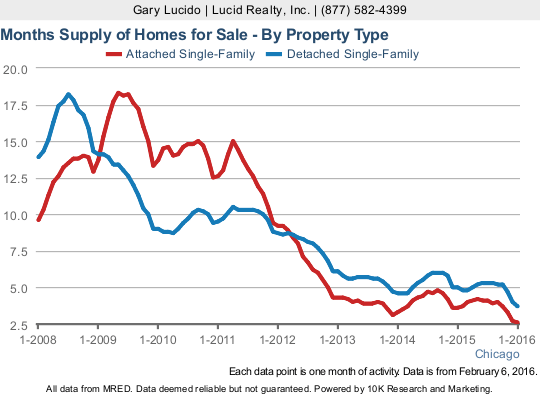
Chicago Home Inventory
It’s actually a miracle that sales aren’t just plummeting with the availability of homes for sale so low. Home inventory levels just keep hitting more and more ridiculously low levels. We are now down to a mere 2.6 month supply of condos and townhomes, which is shockingly down from 3.6 months last year at this time. Single family home inventory levels are down to 3.7 months, which is down from 5.0 months last year. Both of these are solidly in “sellers market” territory.
And, yet, we don’t see overall prices skyrocketing, though we do see healthy increases in many niches.
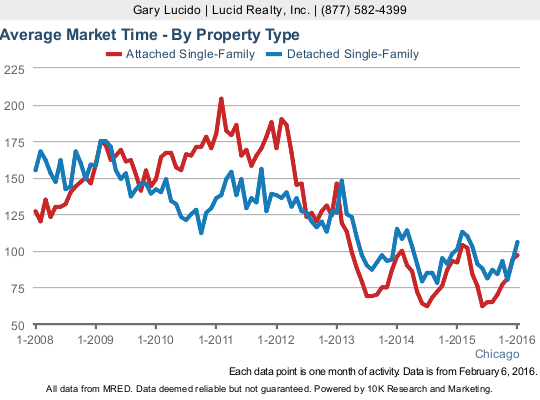
Chicago Home Sale Market Times
Once again you would think that with inventory levels so low we would see plummeting market times but not so! Condos and townhomes that did sell sold on average in 97 days, which was actually up from 92 days last year. Meanwhile, single family homes sold in 106 days, up from 101 days last year. Now how could this be? Are sellers just asking too much for the market? Or are buyers really picky despite the ridiculously low level of inventories?
#realestate #chicagorealestate
Gary Lucido is the President of Lucid Realty, the Chicago area’s full service discount real estate brokerage. If you want to keep up to date on the Chicago real estate market, get an insider’s view of the seamy underbelly of the real estate industry, or you just think he’s the next Kurt Vonnegut you can Subscribe to Getting Real by Email using the form below. Please be sure to verify your email address when you receive the verification notice.
