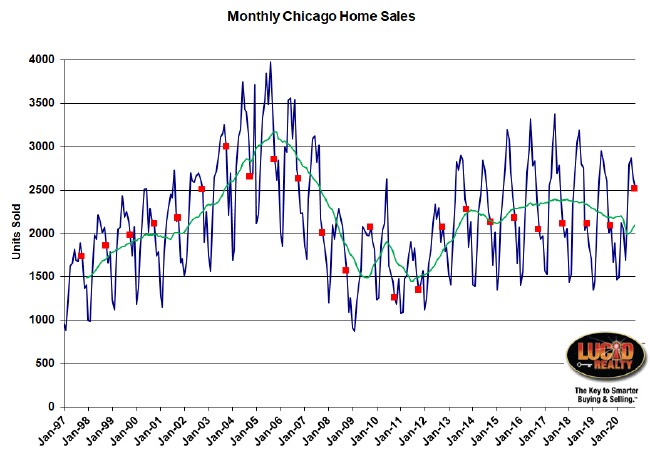
As we all know the Chicago real estate market took a big hit for a few months due to the pandemic but it’s coming back strong. October was another blowout month – not quite as good as September’s 31.6% jump from last year though. Nevertheless, a 22.6% gain is pretty darn good and there’s probably more to come in November and December. Note that in about 2 weeks the Illinois Association of Realtors will report a 20.3% gain over last year. Their calculation is not as robust as mine.
Check out the graph of monthly sales below for the historical perspective. All the Octobers are flagged in red and the green line is a 12 month moving average. We just had the strongest October in 14 years. Also, look closely at that green line to see what’s been going on this year. Just as home sales were trending upwards the pandemic hit and things went down the toilet. Now it’s coming back but it still hasn’t caught up to where it was at the beginning of the year. The moving average is currently below last year’s level by 3.8% but it’s closing the gap. It’s entirely possible that the gap will close by year end.
Chicago Home Contract Activity
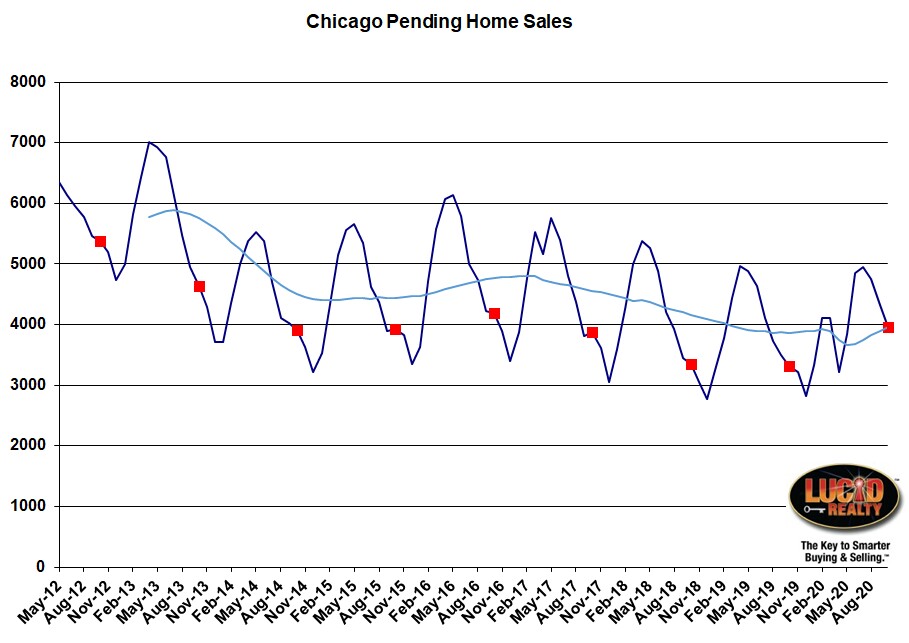
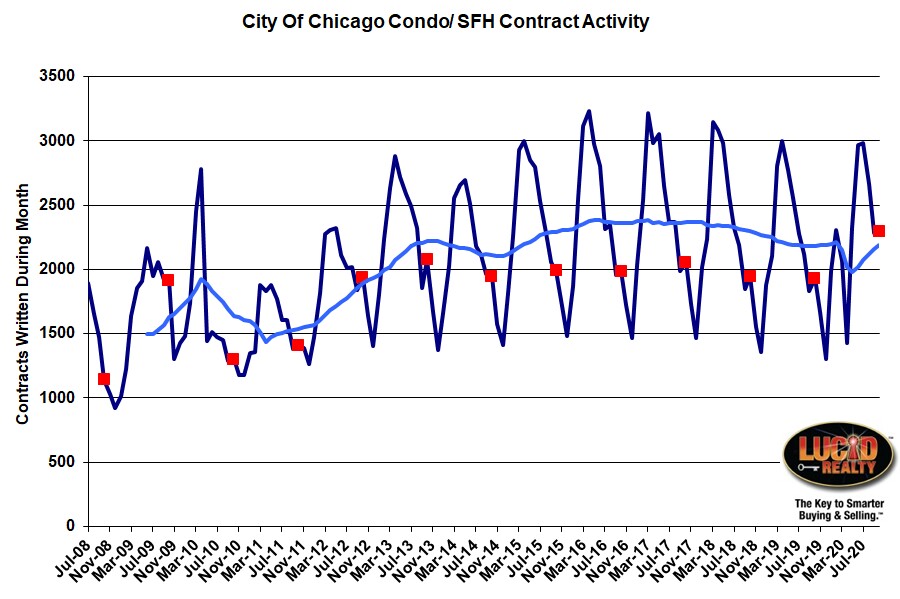
Contract activity continues to run really strong with an 18.7% boost in October over last year which catapulted October to a record high since I’ve been tracking the data. That’s also 5 straight months of double digit percentage increases over last year. That bodes well for closings in the next month or two as these contracts start to close. Contract activity has been so strong lately that the moving average in the graph below has pretty much caught up to where it was at the beginning of the year.
Pending Home Sales
Pending home sales reached a 4 year high in October, up 637 units from last year. Those units are now available for closings over the next couple of months. Also, if you look at the moving average in the graph below you’ll see that we’ve pretty much fully recovered from the dip caused by the pandemic.
Distressed Home Sales
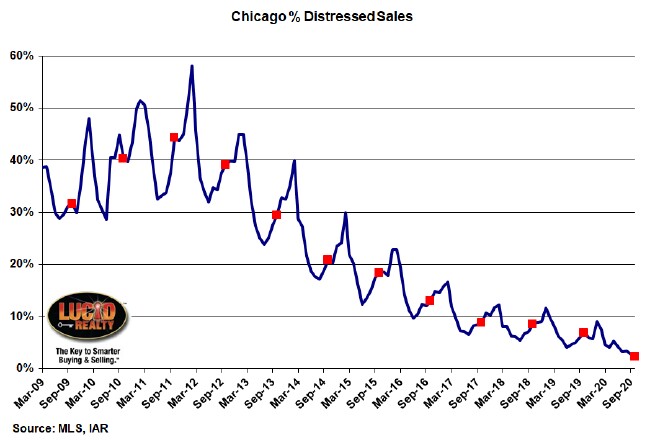
October hit another new low in the percentage of home sales that were distressed – 2.4%, down from 6.9% last year. Of course, it helps that there is a moratorium on foreclosures right now but once that is lifted distressed home sales could take off again.
Chicago Home Inventory
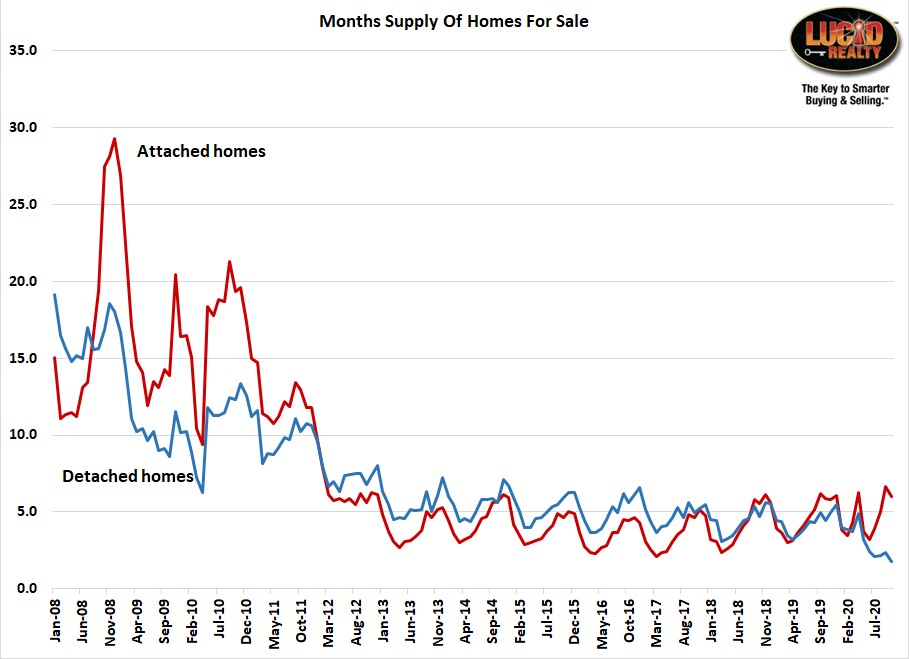
You may have heard rumors that there is a shortage of single family homes in Chicago but there is a glut of condos for sale. Well, here’s the data and that popular narrative is only half true. Check out the graph below where I’m still calculating my own measure of months of supply because I think there are serious issues with the standard measures in the current environment. It clearly shows a recent divergence between the inventory for the two types of homes, with detached (single family) homes hitting record low levels of a 1.8 month supply while attached (condos and townhomes) homes are at the upper end of their range with a 6.0 month supply. Attached inventory is high, higher than detached inventory but not at record levels. In fact, last October had a 5.9 month supply of attached homes.
So why the discrepancy with the popular narrative? Because there are a ton of condos and townhomes on the market right now but there is also really strong contract activity to readily absorb that inventory. So, on a months of supply basis, the inventory is not ridiculously high. That’s precisely why I’m using my own months of supply metric – to reflect this effect.
Chicago Home Sale Market Times
Homes are selling pretty fast in Chicago as you can clearly see in the graph below. Single family homes that closed in October sold in record time this year, dropping from 78 days last year to only 68 days this year. And, despite what you may have heard about the high inventory of condos, their average market time fell even more than single family homes – from 83 days to 61 days this year.
As I’ve pointed out before the median market times have fallen by even greater percentages than the average market times. While the average market time on attached sales has fallen by 26.5% the median market time has fallen by 51.8%. For detached sales the average fell by 12.8% vs. a 59.5% decline in the median market time. These are dramatic declines and indicate a very strong market – even for condos and townhomes.
Now, if you are a regular reader of my blog you may have noticed that in my last post I concluded that Chicago homes are not selling any faster than last year. I have to admit that that analysis is obviously totally inconsistent with this one. I don’t think there’s an easy explanation but the data tells us what the data tells us. The two analyses are very different and that may be what holds the key to the discrepancy. Last week’s analysis was based on homes listed in early June whereas today’s analysis surely includes many homes listed long after that. The market definitely heated up since then. Also, last week’s analysis is based on newly listed homes whereas today’s analysis includes homes that have been sitting on the market for a while. In other words, it’s possible that some of the reduction in market time could be coming from some stagnant homes suddenly selling.
If you would like some additional market data on Chicago real estate just click that link to visit our Web site.
#RealEstate #ChicagoRealEstate #Coronavirus
Gary Lucido is the President of Lucid Realty, the Chicago area’s full service real estate brokerage that offers home buyer rebates and discount commissions. If you want to keep up to date on the Chicago real estate market or get an insider’s view of the seamy underbelly of the real estate industry you can Subscribe to Getting Real by Email using the form below. Please be sure to verify your email address when you receive the verification notice.
