Last month I was thinking that the Chicago real estate market was losing steam in its recovery from the pandemic slowdown. The year over year gains were declining as we reached the end of the year. However, I just looked at the December data and that trend was broken.
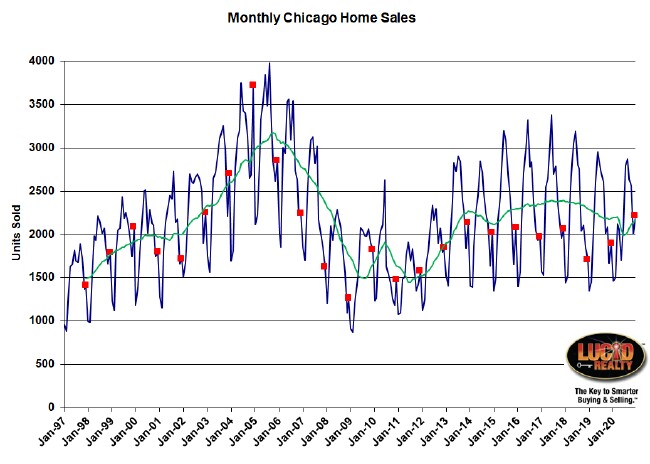
The graph below has monthly home sales for Chicago going back to 1997 along with a 12 month moving average. All the December data points are flagged in red. When all the sales are eventually recorded last month will likely be the highest December in 15 years. It was up 19.3% over the previous year, compared to November’s 18.4% increase. So no diminishment (that’s a real word despite what spell check thinks) in the sales increase from November to December.
When the Illinois Association of Realtors reports on December sales in a couple of weeks they will report a 17.1% increase, which will be wrong.
Since it’s the end of the year that moving average line also tells us how the year went. You can see where it dipped down during the initial lockdown but then it started to recover. It’s almost back to where it was at the end of 2019. 2020 will end up down less than 0.8% for the year, going out strong in December.
Chicago Home Contract Activity
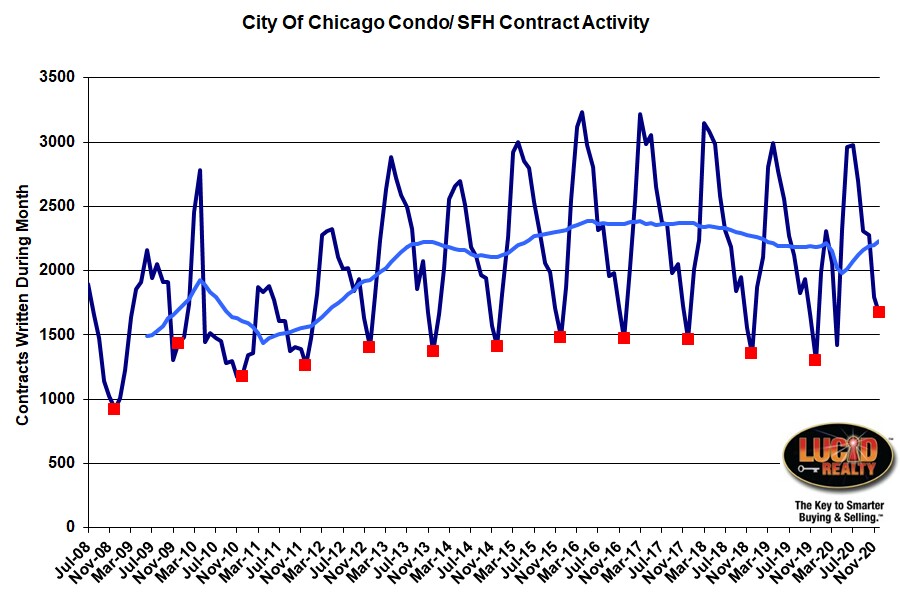
But it’s contract activity that showed even more impressive growth in December – up 28.8% over last year. That’s the 7th month in a row of higher activity than the previous year and the highest growth in 5 months. In addition, it’s the highest level of contract activity for a December since I’ve been tracking the data – 13 years now. And on a 12 month basis we’re higher than we were a year ago so we’ve stopped that long term decline you can see in the graph below.
Pending Home Sales
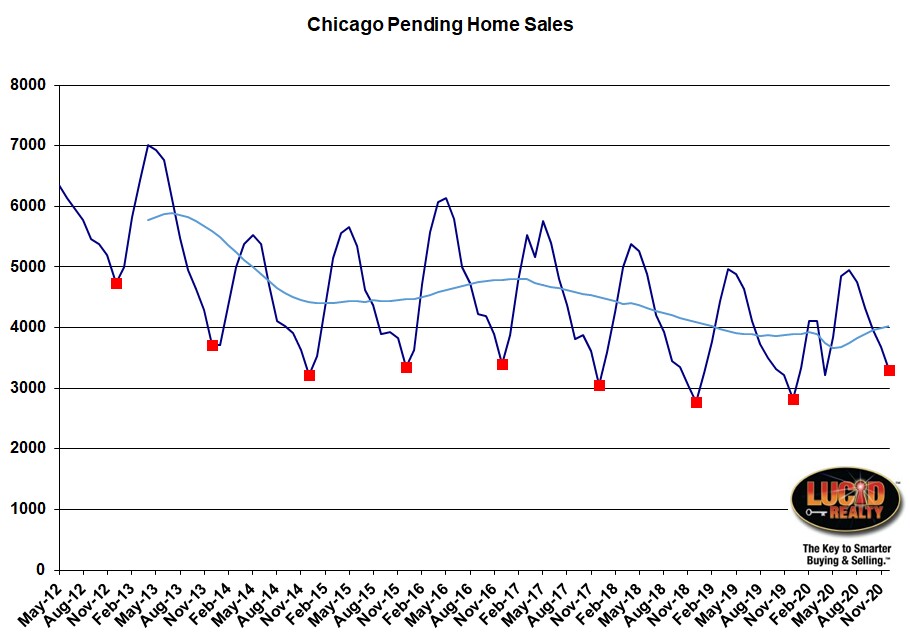
OK. So we had major growth in home sales and even greater growth in contracts. So how does that leave us positioned for the next couple of months? That’s where pending home sales come in and it’s looking good. Pending home sales rose by 421 units last month to the highest level in 4 years. That bodes well for sales in the next couple of months when you consider that January is typically the lowest sales month of the year. Last January only had 1465 closings and now we have an extra 421 homes sitting in the wings waiting to close.
Distressed Home Sales
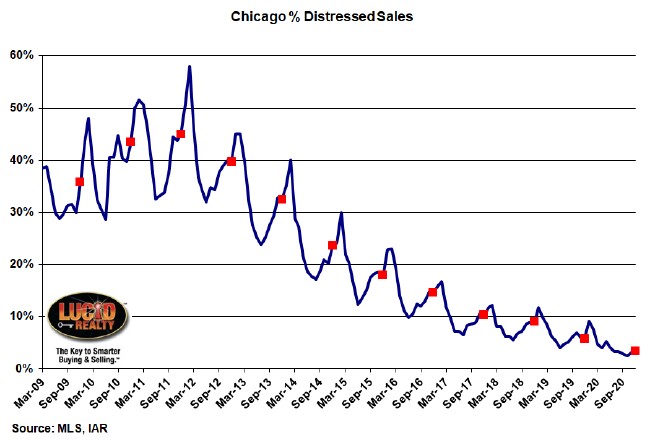
The spigot to the foreclosure pipeline has essentially been shut off so it’s no surprise that we continue to see a decline in the percentage of distressed home sales in Chicago. We just hit another record low of only 3.4%, down from last year’s 5.8%.
Chicago Home Inventory
There’s been a lot of discussion about how hot the Chicago real estate market is. No doubt activity is strong but does this mean the market is hot? I don’t think that lots of activity necessarily translates into “strength”. It could just be that the pandemic has caused people to rethink their housing choices and people are moving around. However, the real sign of strength is home prices and, indeed with the latest Case Shiller numbers, we’ve finally started to see a real uptick in Chicago area prices.
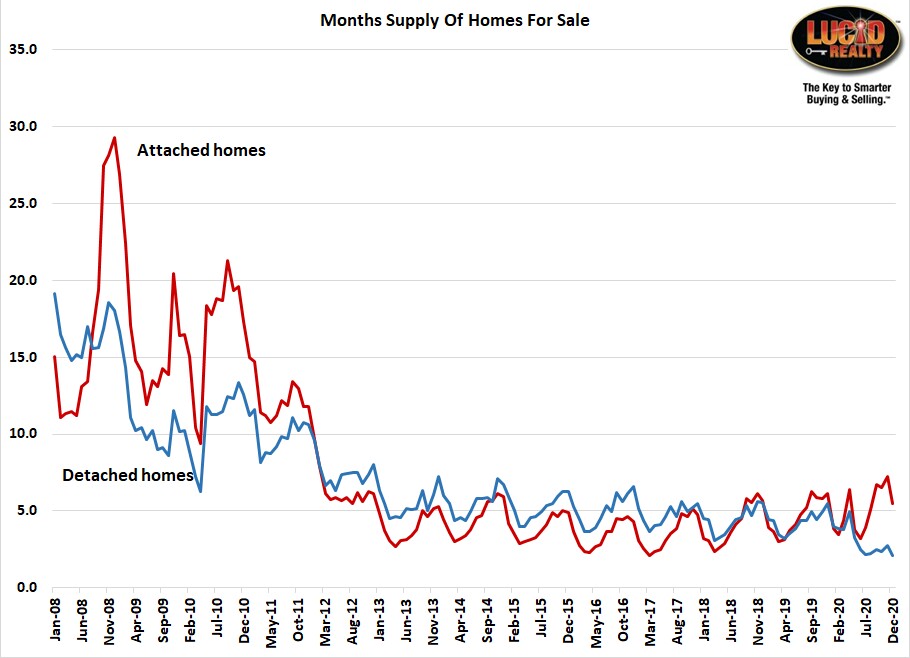
What drives home prices up? Usually it happens when demand outstrips supply, which is why we look at housing inventory relative to demand – i.e. months of supply. I’m still doing my own calculation to produce the graph below because the canned reports are not reflecting the rapidly changing dynamics of the housing market right now.
What I’m seeing is that there is clearly a sharp divergence between the months of supply of condos/ townhomes and single family homes. Condo inventory was at a 5.5 month supply in December, which is actually kinda normal for December. In fact it was lower than 2019’s 6.1 month supply despite the fact that there were an extra 1400 condos on the market this December. How is that possible? Because there were a lot more contracts written this December.
On the other hand the inventory of single family homes hit a new record low for any month of the year of only a 2.1 month supply – the lowest level in the 13 years of data I have. And normally December hits a seasonal high. For example, the previous December had a 5.5 month supply of inventory so that’s a huge drop. It will be interesting to see where we end up in the spring when it normally hits a low.
Chicago Home Sale Market Times
In this environment both condos (attached) and single family homes (detached) continue to sell really fast. Condos that sold did so in an average of only 81 days, which is down from 98 days last year while single family homes sold in 69 days vs 96 days last year. In the graph below it looks like single family homes are selling in record time, which should be no surprise given how little inventory there is.
Additional real estate market data for Chicago is also available on our Web site.
#RealEstate #ChicagoRealEstate #Coronavirus
Gary Lucido is the President of Lucid Realty, the Chicago area’s full service real estate brokerage that offers home buyer rebates and discount commissions. If you want to keep up to date on the Chicago real estate market or get an insider’s view of the seamy underbelly of the real estate industry you can Subscribe to Getting Real by Email using the form below. Please be sure to verify your email address when you receive the verification notice.
