I started out reading this research report that was created by Google in conjunction with the National Association of
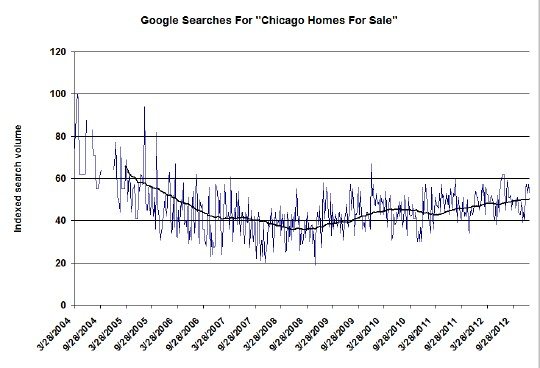
Realtors about online real estate search behavior on Google. Instead of learning something interesting I quickly realized that I was reading a marketing piece about why realtors should buy lots of advertising on Google. So I finally decided that it would be more interesting to look at the long term Google search trends for Chicago real estate – specifically the term “Chicago homes for sale”. I pulled up the search trend activity by week going back to early 2004 and created the graph below. The data is so variable and seasonal that I smoothed it out by also graphing the 52 week moving average, which is the heavy black line below.
What is really striking in the graph is how way back in 2004 search activity was trending down in a big way even though Chicago real estate activity was still trending up. Check out the first graph in my December Chicago real estate market update, which goes back to 1997. That graph shows sales activity peaking in late 2005, about 1 year before the bubble actually burst but well after the decline in search activity for Chicago real estate was underway. So my conclusion is that maybe people conduct casual searches on Google long before they really buy something. In other words, maybe this search activity is a leading indicator of actual real estate sales in Chicago.
The other interesting observation from the graph above, and certainly more pertinent, is the way that the Chicago real estate search activity has been trending upward since the low in late 2008. That seems consistent with our observation of increasing sales in the last couple of years.
